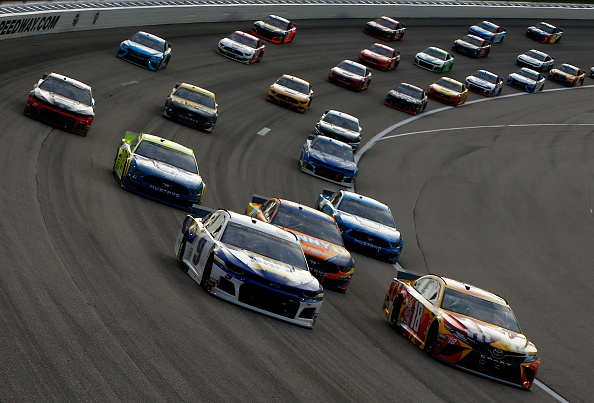
Elimination race number two is on tap this Sunday and it’s host, Kansas Speedway, is ready for another exciting race. The last time Kansas held a race this year, several cars started in the rear of the pack and there was plenty of multi-groove racing that prevailed and allowed cars to move up through the field pretty handily. This weekend, the temperatures should be close to what they were last race as it was a night race and this one is a fall race in October, meaning the same type of racing should happen on Sunday.
This is a 1.5-mile track that has progressive banking in the corners meaning it gets steeper the closer you get to the wall allowing a few different grooves to be raced throughout the race. With it being a 400-mile race, there are 267 laps for the scheduled event with stages at 80 laps, 80 laps, and 107 laps for the final stage. It should be noted that this is still one of the newer tracks on the schedule with the first race being in 2001, though there have been repaves and a reconfiguration that put in the variable banking. This has been a cutoff race for the last few seasons and in the last five runnings of this event, a single driver has led 100 or more laps in each one, but only once (2014) did that driver win the race, though in 2017’s race, the winner led 91 for the second most led that day.
Starting Position of Winners
| Starting Pos. | Races Won | Starting Pos. | Races Won |
| 1 | 6 | 11 | 2 |
| 2 | 1 | 12 | 1 |
| 3 | 1 | 13 | 2 |
| 4 | 3 | 14 | 1 |
| 5 | 2 | 19 | 3 |
| 6 | 2 | 21 | 1 |
| 7 | 1 | 25 | 1 |
| 10 | 1 | | |
Of the 27 races that have happened in total at Kansas, six winners have come from the pole overall with it happening most recently in the 2018 spring race and the 2017 Fall race. Interestingly there are 15 different spots that have seen a winner start there with two others, aside from the pole, having three winners each. There are seven drivers in the field this week with a PD mark of at least five in the last 2-5 Fall races.
Track Data
Drivers To Watch This Week:
Hey folks, I’m still not at 100% and still recovering from a vicious bout of Bronchitis and so recording a video is still a tough task. I promise to be recovered for the podcast this week and I have written up the drivers to watch once more. Sorry for the inconvenience of no video.
Chase Elliott (DK $10,100, FD $12,500) – Elliott left Talladega in a near need-to-win situation this weekend in Kansas but the good news for him is that he’s the defending winner of this race from a year ago. In three Fall races at Kansas, he’s got the win and two top-10s and has three top-fives and four top-10s in seven career Cup races here. The pressure of a must-win is something that he’s risen to in the past and looked good at Talladega even after his car got so smashed it was sitting crocked on the chassis.
Alex Bowman (DK $8,600, FD $9,700) – Bowman is below the cutoff line heading into Sunday’s elimination race and he’s been pretty solid here with two top-10s in the four Fall races he’s run and finishing second after leading 63 laps in the Spring race. He has four top-10s and an average finish of 10.6 in the nine 1.5-mile tracks this year which bodes well for success on Sunday especially at this price point even though he’s more expensive on both sites than he was in May.
Clint Bowyer (DK $8,800, FD $10,000) – This is Bowyer’s home track, though it hasn’t welcomed him like home tracks typically do. He’s got three top-20s in the last five Fall races and seven top-20s in the last 10 Kansas races overall. He just signed an extension to stay at SHR through 2020 and is below the cutline for the Round of 8. Bowyer did finish fifth after starting second in the May race and ran eighth in both of the first two stages. How pumped would he be to punch a ticket to the Round of 8 and come up with a great showing at his home track?
Chris Buescher (DK $6,700, FD $6,600) – Buescher has been great at this distance this year with four top-10s in nine races and a position differential of 9.7 with an average finish of 13.4. At Kansas specifically, he’s got a top-10 and two top-20s in the last three Fall races with a 9.4 PD mark while posting two top-10s in seven overall races. The prices are great on both sites for him this week and now with the driver he’s replacing next year, being announced as the driver taking his current ride, it might be more motivation to show out on Sunday.
William Byron (DK $8,200, FD $9,400) – Byron qualifies as the contrarian play of the week this week for a combination of things. He typically doesn’t do well at Kansas as he has just one top-20 in three career races here, which came in May after he started third and dropped to 20th. He’s been solid from an intermediate track perspective this year with four top-10s in nine races but does drop nearly four spots a race. The enticing thing with him is that he’s in a win to get in position this week as the stage points and final points will require someone ahead of him to crash out whereas him winning, takes care of everything. He is more expensive on both sites than he was in May.
Last Five Hollywood Casino 400s
| | | Avg. | Run | Avg. | Pos. | | Top | Top | Top | Top |
| Driver | # | Start | Pos. | Finish | Diff. | W | 5 | 10 | 15 | 20 |
| Joey Logano | 5 | 8.4 | 7 | 6.8 | 1.6 | 2 | 3 | 4 | 4 | 4 |
| Martin Truex Jr | 5 | 7.8 | 9.4 | 7.2 | 0.6 | 1 | 3 | 3 | 5 | 5 |
| Chase Elliott | 3 | 13.3 | 9.7 | 12.0 | 1.3 | 1 | 2 | 2 | 2 | 2 |
| Kevin Harvick | 5 | 4 | 5 | 9.8 | -5.8 | 1 | 1 | 2 | 4 | 5 |
| Kyle Busch | 5 | 5.2 | 7 | 5.0 | 0.2 | 0 | 4 | 5 | 5 | 5 |
| Denny Hamlin | 5 | 10 | 11.6 | 8.6 | 1.4 | 0 | 2 | 3 | 5 | 5 |
| Jimmie Johnson | 5 | 21.6 | 13.6 | 16.0 | 5.6 | 0 | 2 | 2 | 3 | 3 |
| Kyle Larson | 5 | 20.4 | 18.8 | 20.6 | -0.2 | 0 | 2 | 2 | 2 | 2 |
| Ryan Blaney | 4 | 17.3 | 9 | 7.8 | 9.5 | 0 | 1 | 3 | 4 | 4 |
| Kurt Busch | 5 | 14.8 | 19.6 | 16.2 | -1.4 | 0 | 1 | 2 | 3 | 4 |
| | | Avg. | Run | Avg. | Pos. | | Top | Top | Top | Top |
| Driver | # | Start | Pos. | Finish | Diff. | W | 5 | 10 | 15 | 20 |
| Erik Jones | 2 | 6 | 14 | 19.5 | -13.5 | 0 | 1 | 1 | 1 | 1 |
| Austin Dillon | 5 | 17.4 | 15.4 | 16.0 | 1.4 | 0 | 0 | 2 | 4 | 4 |
| Brad Keselowski | 5 | 6 | 13.4 | 20.4 | -14.4 | 0 | 0 | 2 | 3 | 3 |
| Alex Bowman | 4 | 20 | 22.8 | 19.8 | 0.2 | 0 | 0 | 2 | 2 | 2 |
| Aric Almirola | 5 | 17.8 | 22 | 22.8 | -5.0 | 0 | 0 | 2 | 2 | 2 |
| Ryan Newman | 5 | 14 | 13.8 | 15.4 | -1.4 | 0 | 0 | 1 | 4 | 4 |
| Paul Menard | 5 | 16.6 | 18.6 | 18.4 | -1.8 | 0 | 0 | 1 | 2 | 4 |
| Chris Buescher | 3 | 23.7 | 20.7 | 14.3 | 9.4 | 0 | 0 | 1 | 1 | 2 |
| Ricky Stenhouse Jr | 5 | 19.6 | 21.6 | 20.0 | -0.4 | 0 | 0 | 0 | 1 | 4 |
| Clint Bowyer | 5 | 19.8 | 19.4 | 23.2 | -3.4 | 0 | 0 | 0 | 1 | 3 |
| | | Avg. | Run | Avg. | Pos. | | Top | Top | Top | Top |
| Driver | # | Start | Pos. | Finish | Diff. | W | 5 | 10 | 15 | 20 |
| Ty Dillon | 2 | 29.5 | 23 | 20.5 | 9.0 | 0 | 0 | 0 | 0 | 1 |
| Matt DiBenedetto | 4 | 30.5 | 26.5 | 24.8 | 5.7 | 0 | 0 | 0 | 0 | 0 |
| David Ragan | 5 | 28.4 | 27.6 | 24.8 | 3.6 | 0 | 0 | 0 | 0 | 2 |
| Michael McDowell | 4 | 25.3 | 25.8 | 25.5 | -0.2 | 0 | 0 | 0 | 0 | 1 |
| Bubba Wallace | 1 | 29 | 23 | 26.0 | 3.0 | 0 | 0 | 0 | 0 | 0 |
| Landon Cassill | 5 | 35.2 | 29.8 | 28.6 | 6.6 | 0 | 0 | 0 | 0 | 0 |
| Daniel Suarez | 2 | 6.5 | 25 | 30.0 | -5.5 | 0 | 0 | 0 | 0 | 0 |
| Corey LaJoie | 2 | 34 | 31.5 | 30.5 | 3.5 | 0 | 0 | 0 | 0 | 0 |
| Reed Sorenson | 5 | 37.4 | 34.2 | 31.8 | 5.6 | 0 | 0 | 0 | 0 | 0 |
| JJ Yeley | 3 | 36.7 | 34.3 | 34.0 | 2.7 | 0 | 0 | 0 | 0 | 0 |
| | | Avg. | Run | Avg. | Pos. | | Top | Top | Top | Top |
| Driver | # | Start | Pos. | Finish | Diff. | W | 5 | 10 | 15 | 20 |
| Joey Gase | 2 | 40 | 37 | 36.0 | 4.0 | 0 | 0 | 0 | 0 | 0 |
| Timmy Hill | 2 | 40 | 37.5 | 36.5 | 3.5 | 0 | 0 | 0 | 0 | 0 |
| William Byron | 1 | 17 | 33 | 38.0 | -21.0 | 0 | 0 | 0 | 0 | 0 |
| Ross Chastain | 1 | 32 | 37 | 39.0 | -7.0 | 0 | 0 | 0 | 0 | 0 |
| Daniel Hemric | 0 | 0 | 0 | 0 | 0 | 0 | 0 | 0 | 0 | 0 |
| Matt Tifft | 0 | 0 | 0 | 0 | 0 | 0 | 0 | 0 | 0 | 0 |
| Ryan Preece | 0 | 0 | 0 | 0 | 0 | 0 | 0 | 0 | 0 | 0 |
| Josh Bilicki | 0 | 0 | 0 | 0 | 0 | 0 | 0 | 0 | 0 | 0 |
| Parker Kligerman | 0 | 0 | 0 | 0 | 0 | 0 | 0 | 0 | 0 | 0 |
| Garrett Smithley | 0 | 0 | 0 | 0 | 0 | 0 | 0 | 0 | 0 | 0 |
| | | Laps | Laps Led | Fastest | Fast Laps | Top-15 | Avg. Driver |
| Driver | # | Led | /Race | Laps | /Race | Rate | Rating |
| Joey Logano | 5 | 266 | 53.2 | 151 | 30.2 | 82% | 114.9 |
| Martin Truex Jr | 5 | 91 | 18.2 | 73 | 14.6 | 89% | 105.6 |
| Chase Elliott | 3 | 48 | 16.0 | 48 | 16.0 | 86% | 103.7 |
| Kevin Harvick | 5 | 269 | 53.8 | 165 | 33.0 | 91% | 119.9 |
| Kyle Busch | 5 | 113 | 22.6 | 75 | 15.0 | 96% | 112 |
| Denny Hamlin | 5 | 6 | 1.2 | 5 | 1.0 | 74% | 91.4 |
| Jimmie Johnson | 5 | 5 | 1.0 | 62 | 12.4 | 72% | 87.5 |
| Kyle Larson | 5 | 0 | 0.0 | 78 | 15.6 | 48% | 83.4 |
| Ryan Blaney | 4 | 12 | 3.0 | 29 | 7.3 | 86% | 99.3 |
| Kurt Busch | 5 | 1 | 0.2 | 11 | 2.2 | 46% | 77.4 |
| | | Laps | Laps Led | Fastest | Fast Laps | Top-15 | Avg. Driver |
| Driver | # | Led | /Race | Laps | /Race | Rate | Rating |
| Erik Jones | 2 | 0 | 0.0 | 21 | 10.5 | 70% | 89 |
| Austin Dillon | 5 | 2 | 0.4 | 17 | 3.4 | 64% | 85.4 |
| Brad Keselowski | 5 | 75 | 15.0 | 52 | 10.4 | 80% | 86.4 |
| Alex Bowman | 4 | 0 | 0.0 | 16 | 4.0 | 37% | 66.4 |
| Aric Almirola | 5 | 0 | 0.0 | 7 | 1.4 | 32% | 66 |
| Ryan Newman | 5 | 6 | 1.2 | 5 | 1.0 | 66% | 82 |
| Paul Menard | 5 | 7 | 1.4 | 9 | 1.8 | 34% | 74.1 |
| Chris Buescher | 3 | 0 | 0.0 | 3 | 1.0 | 14% | 65.8 |
| Ricky Stenhouse Jr | 5 | 1 | 0.2 | 9 | 1.8 | 10% | 64.8 |
| Clint Bowyer | 5 | 0 | 0.0 | 4 | 0.8 | 39% | 66.5 |
| | | Laps | Laps Led | Fastest | Fast Laps | Top-15 | Avg. Driver |
| Driver | # | Led | /Race | Laps | /Race | Rate | Rating |
| Ty Dillon | 2 | 0 | 0.0 | 0 | 0.0 | 8% | 57.4 |
| Matt DiBenedetto | 4 | 0 | 0.0 | 4 | 1.0 | 7% | 47.8 |
| David Ragan | 5 | 0 | 0.0 | 2 | 0.4 | 7% | 50.3 |
| Michael McDowell | 4 | 0 | 0.0 | 11 | 2.8 | 8% | 51.6 |
| Bubba Wallace | 1 | 2 | 2.0 | 2 | 2.0 | 11% | 59.1 |
| Landon Cassill | 5 | 0 | 0.0 | 1 | 0.2 | 1% | 43.7 |
| Daniel Suarez | 2 | 0 | 0.0 | 5 | 2.5 | 16% | 56.5 |
| Corey LaJoie | 2 | 0 | 0.0 | 1 | 0.5 | 2% | 40.2 |
| Reed Sorenson | 5 | 0 | 0.0 | 0 | 0.0 | 0% | 36.9 |
| JJ Yeley | 3 | 0 | 0.0 | 0 | 0.0 | 0% | 36.9 |
| | | Laps | Laps Led | Fastest | Fast Laps | Top-15 | Avg. Driver |
| Driver | # | Led | /Race | Laps | /Race | Rate | Rating |
| Joey Gase | 2 | 0 | 0.0 | 0 | 0.0 | 0% | 29.4 |
| Timmy Hill | 2 | 0 | 0.0 | 0 | 0.0 | 0% | 27.9 |
| William Byron | 1 | 0 | 0.0 | 2 | 2.0 | 2% | 45 |
| Ross Chastain | 1 | 0 | 0.0 | 0 | 0.0 | 0% | 29.5 |
| Daniel Hemric | 0 | 0 | 0 | 0 | 0 | 0 | 0 |
| Matt Tifft | 0 | 0 | 0 | 0 | 0 | 0 | 0 |
| Ryan Preece | 0 | 0 | 0 | 0 | 0 | 0 | 0 |
| Josh Bilicki | 0 | 0 | 0 | 0 | 0 | 0 | 0 |
| Parker Kligerman | 0 | 0 | 0 | 0 | 0 | 0 | 0 |
| Garrett Smithley | 0 | 0 | 0 | 0 | 0 | 0 | 0 |
Top-20 Drivers Over Last 10 Kansas Races
| | | Avg. | Run | Avg. | Pos. | | Top | Top | Top | Top |
| Driver | # | Start | Pos. | Finish | Diff. | W | 5 | 10 | 15 | 20 |
| Kevin Harvick | 10 | 6.2 | 5.1 | 7.0 | -0.8 | 2 | 5 | 6 | 9 | 10 |
| Martin Truex Jr | 10 | 8.5 | 8.4 | 8.1 | 0.4 | 2 | 5 | 6 | 9 | 10 |
| Joey Logano | 10 | 9.8 | 9.9 | 13.2 | -3.4 | 2 | 5 | 6 | 7 | 7 |
| Kyle Busch | 9 | 5.3 | 6.7 | 7.9 | -2.6 | 1 | 6 | 8 | 8 | 8 |
| Chase Elliott | 7 | 16 | 13.7 | 12.9 | 3.1 | 1 | 3 | 4 | 5 | 5 |
| Jimmie Johnson | 10 | 20.6 | 15.1 | 14.7 | 5.9 | 1 | 3 | 4 | 5 | 7 |
| Brad Keselowski | 10 | 6.4 | 12.4 | 13.6 | -7.2 | 1 | 2 | 6 | 8 | 8 |
| Ryan Blaney | 8 | 11.5 | 8.6 | 13.6 | -2.1 | 0 | 3 | 5 | 6 | 6 |
| Kyle Larson | 10 | 19.6 | 13.4 | 17.1 | 2.5 | 0 | 3 | 5 | 6 | 6 |
| Denny Hamlin | 10 | 9 | 13.1 | 16.5 | -7.5 | 0 | 3 | 4 | 6 | 7 |
| | | Avg. | Run | Avg. | Pos. | | Top | Top | Top | Top |
| Driver | # | Start | Pos. | Finish | Diff. | W | 5 | 10 | 15 | 20 |
| Kurt Busch | 10 | 10.9 | 13.6 | 12.6 | -1.7 | 0 | 2 | 6 | 7 | 9 |
| Erik Jones | 6 | 12.3 | 13.8 | 18.5 | -6.2 | 0 | 2 | 3 | 3 | 3 |
| Alex Bowman | 7 | 20 | 22 | 20.3 | -0.3 | 0 | 1 | 3 | 3 | 4 |
| Clint Bowyer | 10 | 21.8 | 18.1 | 18.5 | 3.3 | 0 | 1 | 2 | 4 | 7 |
| Ryan Newman | 10 | 14.6 | 16.1 | 18.7 | -4.1 | 0 | 0 | 3 | 6 | 6 |
| Austin Dillon | 10 | 18.3 | 17.2 | 15.8 | 2.5 | 0 | 0 | 3 | 5 | 8 |
| Aric Almirola | 10 | 17.2 | 19.1 | 20.2 | -3.0 | 0 | 0 | 3 | 5 | 6 |
| Paul Menard | 10 | 15.5 | 18.7 | 21.5 | -6.0 | 0 | 0 | 2 | 3 | 6 |
| Chris Buescher | 7 | 20.6 | 19.7 | 18.4 | 2.2 | 0 | 0 | 2 | 2 | 4 |
| Daniel Suarez | 5 | 15.2 | 21.2 | 21.8 | -6.6 | 0 | 0 | 1 | 2 | 2 |
| | | Laps | Laps Led | Fastest | Fast Laps | Top-15 | Avg. Driver |
| Driver | # | Led | /Race | Laps | /Race | Rate | Rating |
| Kevin Harvick | 10 | 515 | 51.50 | 371 | 37.10 | 92% | 123 |
| Martin Truex Jr | 10 | 475 | 47.50 | 275 | 27.50 | 84% | 110.4 |
| Joey Logano | 10 | 304 | 30.40 | 172 | 17.20 | 78% | 102.3 |
| Kyle Busch | 9 | 242 | 26.89 | 167 | 18.56 | 95% | 111 |
| Chase Elliott | 7 | 93 | 13.29 | 84 | 12.00 | 65% | 94.1 |
| Jimmie Johnson | 10 | 15 | 1.50 | 99 | 9.90 | 62% | 84.5 |
| Brad Keselowski | 10 | 133 | 13.30 | 119 | 11.90 | 78% | 94.3 |
| Ryan Blaney | 8 | 149 | 18.63 | 108 | 13.50 | 82% | 98.1 |
| Kyle Larson | 10 | 104 | 10.40 | 166 | 16.60 | 68% | 93.3 |
| Denny Hamlin | 10 | 6 | 0.60 | 23 | 2.30 | 69% | 84.1 |
| | | Laps | Laps Led | Fastest | Fast Laps | Top-15 | Avg. Driver |
| Driver | # | Led | /Race | Laps | /Race | Rate | Rating |
| Kurt Busch | 10 | 31 | 3.10 | 31 | 3.10 | 70% | 89.7 |
| Erik Jones | 6 | 2 | 0.33 | 43 | 7.17 | 71% | 84.6 |
| Alex Bowman | 7 | 63 | 9.00 | 53 | 7.57 | 42% | 70.6 |
| Clint Bowyer | 10 | 15 | 1.50 | 18 | 1.80 | 42% | 71.1 |
| Ryan Newman | 10 | 6 | 0.60 | 5 | 0.50 | 55% | 77.9 |
| Austin Dillon | 10 | 6 | 0.60 | 21 | 2.10 | 48% | 77.7 |
| Aric Almirola | 10 | 0 | 0.00 | 10 | 1.00 | 41% | 72.1 |
| Paul Menard | 10 | 7 | 0.70 | 24 | 2.40 | 42% | 71.6 |
| Chris Buescher | 7 | 10 | 1.43 | 5 | 0.71 | 23% | 67.2 |
| Daniel Suarez | 5 | 0 | 0.00 | 13 | 2.60 | 28% | 65.1 |
Top-20 Drivers Over Similar Races (Las Vegas, Kansas, Kentucky, Chicagoland)
| | | Avg. | Run | Avg. | Pos. | | Top | Top | Top | Top |
| Driver | # | Start | Pos. | Finish | Diff. | W | 5 | 10 | 15 | 20 |
| Martin Truex Jr | 20 | 10.4 | 7.2 | 6.1 | 4.3 | 8 | 13 | 16 | 17 | 20 |
| Brad Keselowski | 20 | 7.5 | 9.9 | 7.8 | -0.3 | 3 | 10 | 16 | 18 | 19 |
| Kyle Busch | 20 | 7.6 | 7.9 | 9.5 | -1.9 | 2 | 9 | 14 | 16 | 17 |
| Kevin Harvick | 20 | 4.9 | 8.3 | 12.8 | -7.9 | 2 | 8 | 12 | 15 | 16 |
| Chase Elliott | 18 | 12.5 | 11.7 | 12.9 | -0.4 | 1 | 8 | 9 | 13 | 14 |
| Joey Logano | 20 | 10.4 | 9.8 | 10.1 | 0.3 | 1 | 7 | 16 | 17 | 17 |
| Denny Hamlin | 20 | 12.3 | 11.9 | 11.0 | 1.3 | 1 | 7 | 11 | 15 | 18 |
| Kurt Busch | 20 | 10.1 | 11.5 | 15.0 | -4.9 | 1 | 5 | 9 | 11 | 15 |
| Alex Bowman | 14 | 16.6 | 16.5 | 16.1 | 0.5 | 1 | 2 | 6 | 7 | 11 |
| Kyle Larson | 20 | 15.7 | 10.6 | 9.5 | 6.2 | 0 | 10 | 15 | 16 | 18 |
| | | Avg. | Run | Avg. | Pos. | | Top | Top | Top | Top |
| Driver | # | Start | Pos. | Finish | Diff. | W | 5 | 10 | 15 | 20 |
| Ryan Blaney | 18 | 10.8 | 11 | 12.6 | -1.8 | 0 | 7 | 11 | 13 | 14 |
| Erik Jones | 16 | 13.4 | 14.1 | 15.3 | -1.9 | 0 | 3 | 9 | 11 | 11 |
| Clint Bowyer | 20 | 15.4 | 15.7 | 16.0 | -0.6 | 0 | 2 | 5 | 11 | 15 |
| Ryan Newman | 20 | 19.4 | 17.2 | 18.3 | 1.1 | 0 | 2 | 5 | 8 | 12 |
| Jimmie Johnson | 20 | 15.1 | 15.1 | 16.6 | -1.5 | 0 | 1 | 4 | 12 | 14 |
| Aric Almirola | 19 | 17 | 15 | 15.2 | 1.8 | 0 | 0 | 8 | 13 | 15 |
| Paul Menard | 20 | 17 | 17.6 | 16.9 | 0.1 | 0 | 0 | 3 | 11 | 14 |
| Daniel Suarez | 16 | 13.8 | 17.7 | 18.0 | -4.2 | 0 | 0 | 3 | 7 | 11 |
| Chris Buescher | 18 | 23.5 | 21.1 | 19.7 | 3.8 | 0 | 0 | 3 | 5 | 11 |
| William Byron | 11 | 14.3 | 18.1 | 22.2 | -7.9 | 0 | 0 | 2 | 2 | 7 |
| | | Laps | Laps Led | Fastest | Fast Laps | Top-15 | Avg. Driver |
| Driver | # | Led | /Race | Laps | /Race | Rate | Rating |
| Martin Truex Jr | 20 | 1012 | 50.6 | 740 | 37.0 | 88% | 115.9 |
| Brad Keselowski | 20 | 439 | 22.0 | 381 | 19.1 | 81% | 102 |
| Kyle Busch | 20 | 829 | 41.5 | 529 | 26.5 | 85% | 111.1 |
| Kevin Harvick | 20 | 1037 | 51.9 | 585 | 29.3 | 83% | 113.6 |
| Chase Elliott | 18 | 218 | 12.1 | 192 | 10.7 | 77% | 97.1 |
| Joey Logano | 20 | 429 | 21.5 | 233 | 11.7 | 80% | 100.4 |
| Denny Hamlin | 20 | 44 | 2.2 | 116 | 5.8 | 74% | 90.7 |
| Kurt Busch | 20 | 186 | 9.3 | 148 | 7.4 | 77% | 91.8 |
| Alex Bowman | 14 | 160 | 11.4 | 119 | 8.5 | 57% | 80.7 |
| Kyle Larson | 20 | 143 | 7.2 | 273 | 13.7 | 80% | 99.1 |
| | | Laps | Laps Led | Fastest | Fast Laps | Top-15 | Avg. Driver |
| Driver | # | Led | /Race | Laps | /Race | Rate | Rating |
| Ryan Blaney | 18 | 180 | 10.0 | 234 | 13.0 | 73% | 95.4 |
| Erik Jones | 16 | 4 | 0.3 | 110 | 6.9 | 72% | 86.7 |
| Clint Bowyer | 20 | 77 | 3.9 | 57 | 2.9 | 55% | 78 |
| Ryan Newman | 20 | 21 | 1.1 | 21 | 1.1 | 42% | 72.2 |
| Jimmie Johnson | 20 | 150 | 7.5 | 147 | 7.4 | 59% | 81.1 |
| Aric Almirola | 19 | 73 | 3.8 | 103 | 5.4 | 60% | 82.5 |
| Paul Menard | 20 | 0 | 0.0 | 36 | 1.8 | 42% | 71.5 |
| Daniel Suarez | 16 | 94 | 5.9 | 42 | 2.6 | 41% | 72 |
| Chris Buescher | 18 | 11 | 0.6 | 16 | 0.9 | 17% | 61.9 |
| William Byron | 11 | 40 | 3.6 | 51 | 4.6 | 40% | 71.3 |
Team Averages at Kansas (Since Feb. 2017)
| | Avg. | | | Top | Top |
| Driver | Finish | Races | Wins | 5 | 10 |
| Stewart-Haas Racing | 13.2 | 20 | 1 | 4 | 9 |
| Wood Brothers Racing | 13.8 | 5 | 0 | 2 | 3 |
| Joe Gibbs Racing | 14.85 | 20 | 0 | 6 | 10 |
| Team Penske | 15.08 | 13 | 1 | 3 | 6 |
| Hendrick Motorsports | 15.45 | 20 | 1 | 4 | 7 |
| Chip Ganassi Racing | 15.7 | 10 | 0 | 2 | 6 |
| Roush Fenway Racing | 20.1 | 10 | 0 | 0 | 1 |
Momentum
The nine intermediate tracks competed on this year are used for the momentum section this week.
Driver
| Driver Momentum |
| | | Avg. | Run | Avg. | Pos. | | Top | Top | Top | Top | Avg. Driver |
| Driver | # | Start | Pos. | Finish | Diff. | W | 5 | 10 | 15 | 20 | Rating |
| Brad Keselowski | 9 | 12.2 | 12.7 | 10.2 | 2 | 2 | 6 | 6 | 6 | 8 | 95.8 |
| Martin Truex Jr | 9 | 18.8 | 10.8 | 9.6 | 9.2 | 2 | 3 | 5 | 7 | 9 | 99.5 |
| Erik Jones | 9 | 16.6 | 16.3 | 12.7 | 3.9 | 1 | 4 | 6 | 7 | 7 | 84.4 |
| Kurt Busch | 9 | 11.6 | 10.3 | 12.3 | -0.7 | 1 | 3 | 6 | 7 | 7 | 99.7 |
| Joey Logano | 9 | 15.7 | 11 | 10.1 | 5.6 | 1 | 3 | 5 | 7 | 8 | 101.4 |
| Alex Bowman | 9 | 14.9 | 13.1 | 10.6 | 4.3 | 1 | 2 | 4 | 6 | 9 | 90.2 |
| Denny Hamlin | 9 | 10.2 | 11.6 | 13.2 | -3 | 1 | 2 | 3 | 6 | 8 | 89.3 |
| Kevin Harvick | 9 | 7.7 | 7.4 | 9 | -1.3 | 0 | 4 | 6 | 8 | 8 | 110.4 |
| Kyle Busch | 9 | 12.9 | 10.2 | 10.9 | 2 | 0 | 4 | 6 | 6 | 7 | 106.7 |
| Kyle Larson | 9 | 16.3 | 12.4 | 13.3 | 3 | 0 | 3 | 5 | 7 | 7 | 94 |
| Clint Bowyer | 9 | 9.1 | 14 | 13.8 | -4.7 | 0 | 3 | 5 | 6 | 6 | 85.4 |
| Chase Elliott | 9 | 14.4 | 10.8 | 10.9 | 3.5 | 0 | 3 | 4 | 7 | 9 | 96.5 |
| | | Avg. | Run | Avg. | Pos. | | Top | Top | Top | Top | Avg. Driver |
| Driver | # | Start | Pos. | Finish | Diff. | W | 5 | 10 | 15 | 20 | Rating |
| Jimmie Johnson | 9 | 8.9 | 13.1 | 13.7 | -4.8 | 0 | 2 | 4 | 5 | 7 | 83.3 |
| Daniel Suarez | 9 | 11.9 | 14.3 | 13.9 | -2 | 0 | 1 | 3 | 5 | 8 | 81 |
| Ricky Stenhouse Jr | 9 | 13.8 | 14.6 | 15.4 | -1.6 | 0 | 1 | 2 | 5 | 7 | 84.3 |
| Ryan Blaney | 9 | 15.8 | 14.2 | 18.1 | -2.3 | 0 | 1 | 2 | 5 | 5 | 87.7 |
| Chris Buescher | 9 | 23.1 | 16.6 | 13.4 | 9.7 | 0 | 0 | 4 | 5 | 9 | 72.4 |
| William Byron | 9 | 9 | 11.6 | 13.6 | -4.6 | 0 | 0 | 4 | 4 | 8 | 87.3 |
| Aric Almirola | 9 | 14.8 | 12.4 | 11.7 | 3.1 | 0 | 0 | 3 | 7 | 9 | 87.1 |
| Ryan Newman | 9 | 21 | 16.8 | 16.2 | 4.8 | 0 | 0 | 2 | 4 | 6 | 69.3 |
| Austin Dillon | 9 | 7.7 | 16.1 | 19.2 | -11.5 | 0 | 0 | 2 | 4 | 6 | 76.8 |
| Paul Menard | 9 | 16.2 | 16.9 | 15.7 | 0.5 | 0 | 0 | 1 | 6 | 7 | 70.6 |
| Matt DiBenedetto | 9 | 23.9 | 22.8 | 24.4 | -0.5 | 0 | 0 | 1 | 1 | 2 | 54.7 |
| David Ragan | 9 | 21.8 | 24.2 | 23.4 | -1.6 | 0 | 0 | 0 | 1 | 2 | 51.7 |
| | | Avg. | Run | Avg. | Pos. | | Top | Top | Top | Top | Avg. Driver |
| Driver | # | Start | Pos. | Finish | Diff. | W | 5 | 10 | 15 | 20 | Rating |
| Michael McDowell | 9 | 17.8 | 23.7 | 26.3 | -8.5 | 0 | 0 | 0 | 1 | 2 | 52.6 |
| Corey LaJoie | 9 | 27.7 | 28.8 | 26.7 | 1 | 0 | 0 | 0 | 1 | 1 | 44.2 |
| Daniel Hemric | 9 | 11.1 | 19.6 | 23.6 | -12.5 | 0 | 0 | 0 | 0 | 4 | 62.3 |
| Ty Dillon | 9 | 23.3 | 25.4 | 24.8 | -1.5 | 0 | 0 | 0 | 0 | 2 | 51 |
| Bubba Wallace | 9 | 23.1 | 25 | 25 | -1.9 | 0 | 0 | 0 | 0 | 0 | 50.7 |
| Ryan Preece | 9 | 23.2 | 24.8 | 26.2 | -3 | 0 | 0 | 0 | 0 | 0 | 49.4 |
| Matt Tifft | 9 | 30.7 | 27.8 | 26.7 | 4 | 0 | 0 | 0 | 0 | 1 | 43.7 |
| Ross Chastain | 9 | 32.6 | 31.1 | 30.7 | 1.9 | 0 | 0 | 0 | 0 | 0 | 37.5 |
| Landon Cassill | 9 | 31.9 | 32.7 | 31.9 | 0 | 0 | 0 | 0 | 0 | 0 | 34.9 |
| Josh Bilicki | 1 | 36 | 34 | 33 | 3 | 0 | 0 | 0 | 0 | 0 | 29.1 |
| Reed Sorenson | 7 | 35.4 | 34.7 | 33.7 | 1.7 | 0 | 0 | 0 | 0 | 0 | 29.8 |
| Joey Gase | 5 | 38.8 | 37.2 | 36 | 2.8 | 0 | 0 | 0 | 0 | 0 | 25.8 |
Team
| Team Momentum |
| | | Avg. | Run | Avg. | Pos. | | Top | Top | Top | Top |
| Team | # | Start | Pos. | Finish | Diff. | W | 5 | 10 | 15 | 20 |
| Chip Ganassi Racing | 16 | 14.0 | 11.4 | 12.8 | 1.2 | 1 | 6 | 11 | 14 | 14 |
| Front Row Motorsports | 24 | 23.4 | 25.2 | 25.5 | -2.0 | 0 | 0 | 0 | 2 | 5 |
| Hendrick Motorsports | 32 | 11.8 | 12.2 | 12.2 | -0.4 | 1 | 7 | 16 | 22 | 33 |
| Joe Gibbs Racing | 32 | 14.6 | 12.2 | 11.6 | 3.0 | 4 | 13 | 20 | 26 | 31 |
| JTG Daugherty Racing | 16 | 23.2 | 20.7 | 19.8 | 3.4 | 0 | 0 | 4 | 5 | 9 |
| Richard Childress Racing | 16 | 9.4 | 17.9 | 21.4 | -12.0 | 0 | 0 | 2 | 4 | 10 |
| Roush Fenway Racing | 16 | 17.4 | 15.7 | 15.8 | 1.6 | 0 | 1 | 4 | 9 | 13 |
| Stewart-Haas Racing | 24 | 10.9 | 12.0 | 12.1 | -1.2 | 0 | 8 | 17 | 26 | 31 |
| Team Penske | 24 | 14.6 | 12.6 | 12.8 | 1.8 | 3 | 10 | 13 | 18 | 21 |
Price Changes at Kansas
DraftKings
| DraftKings Price Changes |
| | May | Oct. | |
| Driver | $ | $ | Difference |
| Kyle Busch | $11,900 | $11,400 | -$500 |
| Kevin Harvick | $10,600 | $11,000 | $400 |
| Martin Truex Jr | $11,400 | $10,800 | -$600 |
| Denny Hamlin | $9,100 | $10,500 | $1,400 |
| Chase Elliott | $11,000 | $10,100 | -$900 |
| Joey Logano | $10,200 | $9,800 | -$400 |
| Brad Keselowski | $9,900 | $9,600 | -$300 |
| Kyle Larson | $8,700 | $9,400 | $700 |
| Ryan Blaney | $9,300 | $9,200 | -$100 |
| Kurt Busch | $9,600 | $9,000 | -$600 |
| Clint Bowyer | $8,500 | $8,800 | $300 |
| Alex Bowman | $7,000 | $8,600 | $1,600 |
| | May | Oct. | |
| Driver | $ | $ | Difference |
| Erik Jones | $8,900 | $8,400 | -$500 |
| William Byron | $6,500 | $8,200 | $1,700 |
| Jimmie Johnson | $8,300 | $8,000 | -$300 |
| Aric Almirola | $8,100 | $7,800 | -$300 |
| Matt DiBenedetto | $6,800 | $7,600 | $800 |
| Daniel Suarez | $8,000 | $7,500 | -$500 |
| Ryan Newman | $7,800 | $7,300 | -$500 |
| Austin Dillon | $7,500 | $7,200 | -$300 |
| Ricky Stenhouse Jr | $7,300 | $7,000 | -$300 |
| Paul Menard | $7,100 | $6,900 | -$200 |
| Chris Buescher | $7,600 | $6,700 | -$900 |
| Daniel Hemric | $6,000 | $6,600 | $600 |
| | May | Oct. | |
| Driver | $ | $ | Difference |
| Ryan Preece | $6,100 | $6,400 | $300 |
| Ty Dillon | $6,600 | $6,200 | -$400 |
| Bubba Wallace | $5,900 | $6,100 | $200 |
| Corey LaJoie | $5,200 | $5,900 | $700 |
| Michael McDowell | $5,600 | $5,800 | $200 |
| Ross Chastain | $5,800 | $5,600 | -$200 |
| David Ragan | $5,500 | $5,500 | $0 |
| Landon Cassill | $5,000 | $5,300 | $300 |
| Matt Tifft | $5,300 | $5,200 | -$100 |
| Reed Sorenson | $5,100 | $4,900 | -$200 |
| Joey Gase | $4,900 | $4,800 | -$100 |
| Timmy Hill | $4,600 | $4,500 | -$100 |
FanDuel
| FanDuel Price Changes |
| | May | Oct. | |
| Driver | $ | $ | Difference |
| Kevin Harvick | $14,000 | $14,500 | $500 |
| Kyle Busch | $15,000 | $14,000 | -$1,000 |
| Martin Truex Jr | $13,500 | $13,500 | $0 |
| Joey Logano | $14,500 | $13,000 | -$1,500 |
| Chase Elliott | $13,200 | $12,500 | -$700 |
| Brad Keselowski | $12,600 | $12,000 | -$600 |
| Denny Hamlin | $12,400 | $11,500 | -$900 |
| Kyle Larson | $10,500 | $11,000 | $500 |
| Ryan Blaney | $12,200 | $10,500 | -$1,700 |
| Clint Bowyer | $11,500 | $10,000 | -$1,500 |
| Alex Bowman | $8,600 | $9,700 | $1,100 |
| William Byron | $7,200 | $9,400 | $2,200 |
| | May | Oct. | |
| Driver | $ | $ | Difference |
| Kurt Busch | $11,200 | $9,200 | -$2,000 |
| Erik Jones | $9,800 | $9,000 | -$800 |
| Jimmie Johnson | $10,000 | $8,500 | -$1,500 |
| Aric Almirola | $11,000 | $8,200 | -$2,800 |
| Ryan Newman | $8,000 | $8,000 | $0 |
| Daniel Suarez | $9,400 | $7,800 | -$1,600 |
| Ricky Stenhouse Jr | $8,400 | $7,500 | -$900 |
| Paul Menard | $7,500 | $7,000 | -$500 |
| Chris Buescher | $6,700 | $6,600 | -$100 |
| Austin Dillon | $9,000 | $6,300 | -$2,700 |
| Matt DiBenedetto | $6,300 | $6,000 | -$300 |
| Daniel Hemric | $5,500 | $5,500 | $0 |
| | May | Oct. | |
| Driver | $ | $ | Difference |
| Bubba Wallace | $5,000 | $5,000 | $0 |
| Ty Dillon | $6,500 | $5,000 | -$1,500 |
| Michael McDowell | $4,500 | $4,500 | $0 |
| Ryan Preece | $6,200 | $4,500 | -$1,700 |
| David Ragan | $6,000 | $4,000 | -$2,000 |
| Corey LaJoie | $3,500 | $3,000 | -$500 |
| Ross Chastain | $4,000 | $3,000 | -$1,000 |
| Matt Tifft | $3,500 | $2,500 | -$1,000 |
| Landon Cassill | $3,000 | $2,000 | -$1,000 |
| Reed Sorenson | $3,000 | $2,000 | -$1,000 |
| Timmy Hill | $2,500 | $2,000 | -$500 |
DraftKings Scoring Averages
| Driver | 2018 | 2017 | 2016 | 2015 | 2014 | Last 2 Avg | Last 5 Avg | DK Seas. Avg. |
| Kyle Busch | 58 | 78 | 38.5 | 40.5 | 46.75 | 68.00 | 52.35 | 60.79 |
| Kevin Harvick | 58 | 64.25 | 93.5 | 30.75 | 48.25 | 61.13 | 58.95 | 48.13 |
| Martin Truex Jr | 47.5 | 97.75 | 30 | 21.5 | 52.5 | 72.63 | 49.85 | 52.12 |
| Denny Hamlin | 25.5 | 39.75 | 22.75 | 45 | 55 | 32.63 | 37.60 | 46.43 |
| Chase Elliott | 79.5 | 52 | 7.5 | | | 65.75 | 46.33 | 39.99 |
| Joey Logano | 73 | 19 | 48.5 | 92 | 109.5 | 46.00 | 68.40 | 45.52 |
| Brad Keselowski | 57.5 | 37 | -23.25 | 39 | -19.5 | 47.25 | 18.15 | 44.12 |
| Kyle Larson | 73 | -16.5 | 10 | 6 | 82.5 | 28.25 | 31.00 | 38.73 |
| Ryan Blaney | 47.75 | 79.75 | 33 | 41.25 | | 63.75 | 50.44 | 36.63 |
| Kurt Busch | 19.5 | 58 | 33.25 | 42.5 | -15.5 | 38.75 | 27.55 | 35.93 |
| Clint Bowyer | 32 | 16.5 | 23.5 | -10 | 27 | 24.25 | 17.80 | 28.21 |
| Alex Bowman | 38 | | 41 | 14 | 13 | 38.00 | 26.50 | 34.64 |
| Driver | 2018 | 2017 | 2016 | 2015 | 2014 | Last 2 Avg | Last 5 Avg | DK Seas. Avg. |
| Erik Jones | 49 | -16.5 | | | | 16.25 | 16.25 | 30.65 |
| William Byron | -14 | | | | | -14.00 | -14.00 | 29.98 |
| Jimmie Johnson | 22.5 | 35.5 | 68 | 78.25 | -4 | 29.00 | 40.05 | 26.93 |
| Aric Almirola | 30.5 | 51 | -1 | 19 | -15 | 40.75 | 16.90 | 30.57 |
| Matt DiBenedetto | 31 | 30 | 23 | 18 | | 30.50 | 25.50 | 31.65 |
| Daniel Suarez | 6.5 | -23 | | | | -8.25 | -8.25 | 30.65 |
| Ryan Newman | 31 | -4 | 29 | 32 | 52 | 13.50 | 28.00 | 36.38 |
| Austin Dillon | 45.5 | 27 | 44.5 | -7 | 46 | 36.25 | 31.20 | 23.89 |
| Ricky Stenhouse Jr | 20.25 | 12.5 | 24 | 37 | 29 | 16.38 | 24.55 | 22.16 |
| Paul Menard | -0.5 | 43.5 | 20.5 | 22.25 | 39.5 | 21.50 | 25.05 | 29.02 |
| Chris Buescher | 33 | 52 | 33.5 | | | 42.50 | 39.50 | 29.66 |
| Daniel Hemric | | | | | | | | 17.83 |
| Driver | 2018 | 2017 | 2016 | 2015 | 2014 | Last 2 Avg | Last 5 Avg | DK Seas. Avg. |
| Ryan Preece | | | | | | | | 22.83 |
| Ty Dillon | 24 | 41 | | | | 32.50 | 32.50 | 28.86 |
| Bubba Wallace | 22.5 | | | | | 22.50 | 22.50 | 24.03 |
| Corey LaJoie | 10.5 | 24 | | | | 17.25 | 17.25 | 23.94 |
| Michael McDowell | 18.5 | 24 | 34 | | 2 | 21.25 | 19.63 | 18.67 |
| Ross Chastain | -2 | | | | | -2.00 | -2.00 | 22.96 |
| David Ragan | 35 | 37 | 0 | 16 | 27 | 36.00 | 23.00 | 15.63 |
| Landon Cassill | 21 | 29 | 24.5 | | 37 | 25.00 | 27.88 | 18.2 |
| Matt Tifft | | | | | | | | 21.42 |
| JJ Yeley | 18 | | | -4 | 24 | 18.00 | 12.67 | 20.85 |
| Parker Kligerman | | | | | | | | 24.85 |
| Reed Sorenson | 11 | 31 | 15 | 10 | 22 | 21.00 | 17.80 | 15.74 |
| Joey Gase | | | 12 | | 12 | | 12.00 | 15.68 |
| Josh Bilicki | | | | | | | | 11.36 |
| Timmy Hill | 4 | | | | 18 | 4.00 | 11.00 | 15.3 |
| Garrett Smithley | | | | | | | | |
FanDuel Scoring Averages
| Driver | 2018 | 2017 | 2016 | 2015 | 2014 | Last 2 Avg | Last 5 Avg | FD Seas. Avg. |
| Kyle Busch | 69.2 | 67.4 | 61.2 | 61.9 | 66.8 | 68.30 | 65.30 | 62.49 |
| Kevin Harvick | 58.3 | 60.4 | 82.1 | 47.9 | 56.3 | 59.35 | 61.00 | 56.66 |
| Martin Truex Jr | 66.2 | 78.8 | 53.2 | 48.9 | 69.2 | 72.50 | 63.26 | 60.21 |
| Denny Hamlin | 51.1 | 62.7 | 48.8 | 68.4 | 69.7 | 56.90 | 60.14 | 59.61 |
| Chase Elliott | 80.1 | 68.7 | 27.8 | | | 74.40 | 58.87 | 52.90 |
| Joey Logano | 66.2 | 44.7 | 66.4 | 80.6 | 83.4 | 55.45 | 68.26 | 58.85 |
| Brad Keselowski | 63.8 | 55 | 7.1 | 57.7 | 12.4 | 59.40 | 39.20 | 55.87 |
| Kyle Larson | 76.7 | -3.7 | 34.5 | 34 | 74.7 | 36.50 | 43.24 | 51.43 |
| Ryan Blaney | 60.1 | 83.5 | 55.2 | 61.9 | | 71.80 | 65.18 | 52.78 |
| Kurt Busch | 46.1 | 73.2 | 55.8 | 63.4 | -0.5 | 59.65 | 47.60 | 53.97 |
| Clint Bowyer | 55.2 | 43.7 | 44.1 | 11 | 50.2 | 49.45 | 40.84 | 48.72 |
| Alex Bowman | 59.2 | | 59.7 | 36.9 | 35.4 | 59.20 | 47.80 | 52.57 |
| Driver | 2018 | 2017 | 2016 | 2015 | 2014 | Last 2 Avg | Last 5 Avg | FD Seas. Avg. |
| Erik Jones | 64.7 | 11.2 | | | | 37.95 | 37.95 | 48.46 |
| William Byron | -2 | | | | | -2.00 | -2.00 | 50.79 |
| Jimmie Johnson | 45.4 | 57.2 | 72.2 | 74.4 | 15 | 51.30 | 52.84 | 48.80 |
| Aric Almirola | 54.2 | 66.7 | 2.1 | 43.2 | 22 | 60.45 | 37.64 | 50.38 |
| Matt DiBenedetto | 48.4 | 49.7 | 45.2 | 39.5 | | 49.05 | 45.70 | 50.03 |
| Daniel Suarez | 35.3 | 9.2 | | | | 22.25 | 22.25 | 50.59 |
| Ryan Newman | 53.1 | 20.8 | 54.2 | 56.4 | 67.8 | 36.95 | 50.46 | 55.66 |
| Austin Dillon | 62.7 | 52.2 | 64.9 | 8.4 | 63.7 | 57.45 | 50.38 | 45.16 |
| Ricky Stenhouse Jr | 45.1 | 35.1 | 48.2 | 57.4 | 50.7 | 40.10 | 47.30 | 44.64 |
| Paul Menard | 27.6 | 61.2 | 45.7 | 46.5 | 60.7 | 44.40 | 48.34 | 50.53 |
| Chris Buescher | 54.1 | 68.7 | 51.2 | | | 61.40 | 58.00 | 49.97 |
| Daniel Hemric | | | | | | | | 40.77 |
| Driver | 2018 | 2017 | 2016 | 2015 | 2014 | Last 2 Avg | Last 5 Avg | FD Seas. Avg. |
| Ryan Preece | | | | | | | | 44.39 |
| Ty Dillon | 44.8 | 58.2 | | | | 51.50 | 51.50 | 49.30 |
| Bubba Wallace | 43 | | | | | 43.00 | 43.00 | 44.40 |
| Corey LaJoie | 28.9 | 43.6 | | | | 36.25 | 36.25 | 43.57 |
| Michael McDowell | 38.7 | 48.7 | 51.2 | | 28.3 | 43.70 | 41.73 | 39.96 |
| Ross Chastain | 2.2 | | | | | 2.20 | 2.20 | 40.55 |
| David Ragan | 53 | 55.7 | 26.8 | 41.1 | 45.2 | 54.35 | 44.36 | 39.13 |
| Landon Cassill | 40.8 | 48.5 | 44.1 | | 53.7 | 44.65 | 46.78 | 37.76 |
| Matt Tifft | | | | | | | | 42.05 |
| JJ Yeley | 38.1 | | | 12.4 | 42.7 | 38.10 | 31.07 | 38.74 |
| Parker Kligerman | | | | | | | | 37.18 |
| Reed Sorenson | 22.2 | 48.3 | 35.6 | 30.8 | 43.3 | 35.25 | 36.04 | 32.82 |
| Joey Gase | | | 33.5 | | 27.8 | | 30.65 | |
| Josh Bilicki | | | | | | | | 26.36 |
| Timmy Hill | 1.3 | | | | 37.4 | 1.30 | 19.35 | 27.40 |
| Garrett Smithley | | | | | | | | |
Weekly Rankings (1=Best, 40=Worst)
Race History, Momentum, Kansas History, and Track Type columns are ranked on average finishes in those spans. Scoring averages are ranked from highest scoring to lowest scoring in those spans.
| Driver | DK$ | FD $ | Race History | Momentum | DK Avg L2 | FD Avg L2 | DK Avg L5 | FD Avg L5 | Kansas History | Track Type History |
| Kyle Busch | $11,400 | $14,000 | 1 | 7 | 2 | 4 | 3 | 2 | 2 | 3 |
| Kevin Harvick | $11,000 | $14,500 | 6 | 1 | 5 | 9 | 2 | 5 | 1 | 8 |
| Martin Truex Jr | $10,800 | $13,500 | 3 | 3 | 1 | 2 | 5 | 4 | 3 | 1 |
| Denny Hamlin | $10,500 | $11,500 | 5 | 12 | 14 | 12 | 9 | 6 | 11 | 6 |
| Chase Elliott | $10,100 | $12,500 | 7 | 7 | 3 | 1 | 6 | 7 | 5 | 9 |
| Joey Logano | $9,800 | $13,000 | 2 | 4 | 7 | 13 | 1 | 1 | 6 | 5 |
| Brad Keselowski | $9,600 | $12,000 | 17 | 5 | 6 | 8 | 23 | 24 | 7 | 2 |
| Kyle Larson | $9,400 | $11,000 | 19 | 13 | 18 | 27 | 12 | 20 | 13 | 3 |
| Ryan Blaney | $9,200 | $10,500 | 4 | 22 | 4 | 3 | 4 | 3 | 7 | 7 |
| Kurt Busch | $9,000 | $9,200 | 12 | 10 | 10 | 7 | 15 | 15 | 4 | 10 |
| Clint Bowyer | $8,800 | $10,000 | 21 | 17 | 20 | 17 | 24 | 23 | 16 | 13 |
| Alex Bowman | $8,600 | $9,700 | 15 | 6 | 11 | 10 | 16 | 14 | 20 | 14 |
| Driver | DK$ | FD $ | Race History | Momentum | DK Avg L2 | FD Avg L2 | DK Avg L5 | FD Avg L5 | Kansas History | Track Type History |
| Erik Jones | $8,400 | $9,000 | 14 | 11 | 28 | 25 | 28 | 25 | 16 | 12 |
| William Byron | $8,200 | $9,400 | 33 | 15 | 33 | 33 | 34 | 34 | 32 | 23 |
| Jimmie Johnson | $8,000 | $8,500 | 10 | 16 | 17 | 16 | 7 | 9 | 9 | 15 |
| Aric Almirola | $7,800 | $8,200 | 20 | 9 | 9 | 6 | 27 | 26 | 19 | 11 |
| Matt DiBenedetto | $7,600 | $6,000 | 22 | 26 | 16 | 18 | 17 | 18 | 30 | 30 |
| Daniel Suarez | $7,500 | $7,800 | 27 | 18 | 32 | 30 | 33 | 31 | 23 | 17 |
| Ryan Newman | $7,300 | $8,000 | 9 | 21 | 29 | 26 | 13 | 11 | 18 | 18 |
| Austin Dillon | $7,200 | $6,300 | 10 | 23 | 12 | 11 | 11 | 12 | 10 | 20 |
| Ricky Stenhouse Jr | $7,000 | $7,500 | 16 | 19 | 27 | 23 | 19 | 16 | 12 | 19 |
| Paul Menard | $6,900 | $7,000 | 13 | 20 | 22 | 20 | 18 | 13 | 22 | 16 |
| Chris Buescher | $6,700 | $6,600 | 8 | 14 | 8 | 5 | 8 | 8 | 15 | 20 |
| Daniel Hemric | $6,600 | $5,500 | 40 | 25 | 40 | 40 | 40 | 40 | 14 | 22 |
| Driver | DK$ | FD $ | Race History | Momentum | DK Avg L2 | FD Avg L2 | DK Avg L5 | FD Avg L5 | Kansas History | Track Type History |
| Ryan Preece | $6,400 | $4,500 | 40 | 29 | 40 | 40 | 40 | 40 | 26 | 27 |
| Ty Dillon | $6,200 | $5,000 | 18 | 27 | 15 | 15 | 10 | 10 | 25 | 28 |
| Bubba Wallace | $6,100 | $5,000 | 25 | 28 | 21 | 22 | 21 | 21 | 28 | 25 |
| Corey LaJoie | $5,900 | $3,000 | 28 | 31 | 26 | 28 | 26 | 27 | 29 | 32 |
| Michael McDowell | $5,800 | $4,500 | 24 | 30 | 23 | 21 | 22 | 22 | 26 | 26 |
| Ross Chastain | $5,600 | $3,000 | 34 | 34 | 31 | 31 | 32 | 33 | 34 | 33 |
| David Ragan | $5,500 | $4,000 | 22 | 24 | 13 | 14 | 20 | 19 | 24 | 24 |
| Landon Cassill | $5,300 | $2,000 | 26 | 35 | 19 | 19 | 14 | 17 | 31 | 29 |
| Matt Tifft | $5,200 | $2,500 | 40 | 31 | 40 | 40 | 40 | 40 | 21 | 30 |
| JJ Yeley | $5,100 | $2,000 | 30 | 36 | 25 | 24 | 29 | 29 | 36 | 35 |
| Parker Kligerman | $5,000 | $2,500 | 40 | 33 | 40 | 40 | 40 | 40 | 40 | 34 |
| Reed Sorenson | $4,900 | $2,000 | 29 | 41 | 24 | 29 | 24 | 28 | 33 | 36 |
| Joey Gase | $4,800 | #N/A | 31 | 43 | 40 | 40 | 30 | 30 | 37 | 39 |
| Josh Bilicki | $4,700 | $2,000 | 40 | 38 | 40 | 40 | 40 | 40 | 40 | 37 |
| Timmy Hill | $4,500 | $2,000 | 32 | | 30 | 32 | 31 | 32 | 35 | 38 |
| Garrett Smithley | #N/A | #N/A | 40 | | 40 | 40 | 40 | 40 | 40 | 40 |