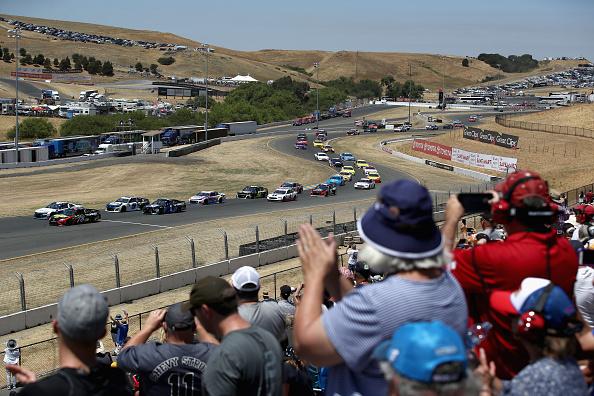
The first road course of the year is on tap this weekend at the famed Sonoma Raceway that used to be called Infineon and Sears Point Raceway. The Cup series has been racing here since 1989 and it has used a couple of different layouts of the track over that span. The most recent layout has been a 1.99-mile 10-turn lap that saw the drivers race 110 laps for a full scheduled race. This year, however, NASCAR has switched things up and gone back to using the Carousel section of the track that makes each lap a 2.52-mile and 12-lap run and shrinks the race to 90 laps overall. It has been a couple of decades since the Carousel was used and therefore none of the drivers in the Cup series have ever raced in that configuration before.
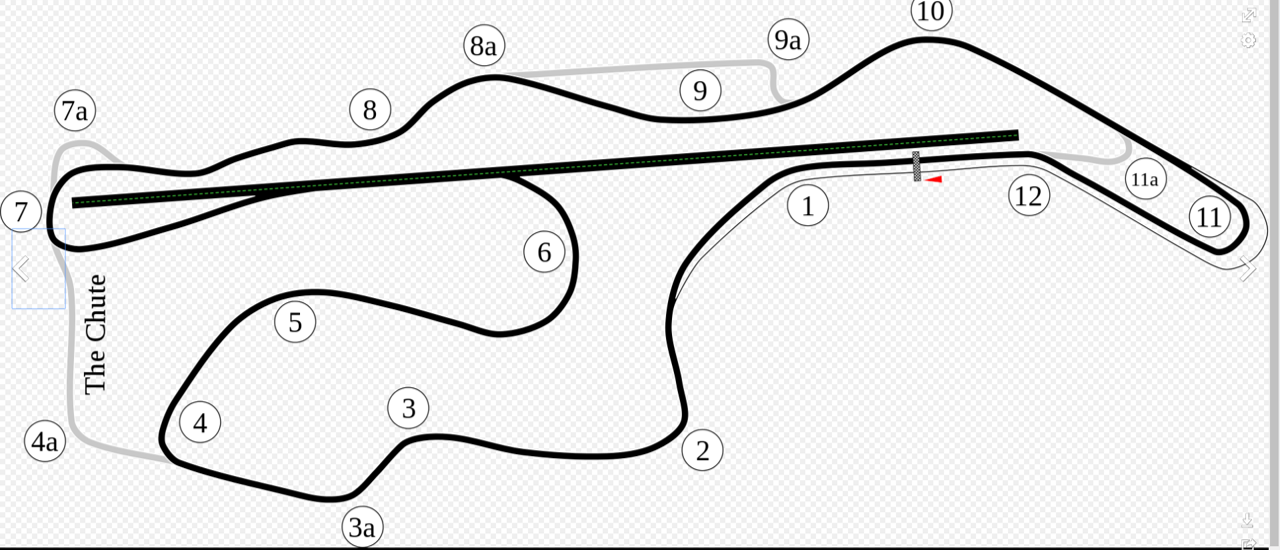
As you can see in the picture above, the current layout is the one that is outlined in black and the straight stretch with the green dotted line down the middle of it is a dragstrip that is now part of the track as they race into Turn 7. The previous layout stayed straight at Turn 4 and turned at 4a going across The Chute and turned at 7a into the s-turns and then followed the rest of the black outlined course. What the picture doesn’t show is the elevation change over a single-lap on this course which is 160 feet which adds a whole other challenge for the drivers to factor in. The increase in turns and the race down the drag strip portion should actually increase passing opportunities as you can get inside of someone on a turn and pass them. Speaking of passing chances, looking below, you’ll see the winners starting spots.
Starting Pos.
Races Won
Starting Pos.
Races Won
1
5
10
1
2
4
11
4
3
2
12
1
4
3
13
1
5
2
14
1
6
1
30
1
7
3
32
1
There are 14 different positions in the starting grid that have seen a winner come from them with each of the top-seven spots seeing at least one winner. Interestingly though, there is a big gap between 14th and then 30th and 32nd. However, in each of the last five races here, there has been at least one driver to start 19th or worse and finish top-six. There are a handful of drivers over the last three or more races here with a +5.0 or bigger position differential.
Drivers To Watch
Last Five Races at Sonoma Raceway
Avg.
Run
Avg.
Pos.
Top
Top
Top
Top
Driver
#
Start
Pos
Finish
Diff.
W
5
10
15
20
Kevin Harvick
5
13.2
8.4
6.6
6.6
1
3
4
4
5
Kyle Busch
5
10.4
12
8.6
1.8
1
3
4
4
4
Martin Truex Jr
5
7.6
14.4
20
-12.4
1
2
2
3
3
Clint Bowyer
5
16.2
16.2
11.6
4.6
0
3
4
4
4
Denny Hamlin
5
14.4
13.2
12
2.4
0
2
3
3
4
Joey Logano
5
13.2
12.8
11
2.2
0
2
2
3
5
Kurt Busch
5
10.2
9.8
7.4
2.8
0
1
4
5
5
Chase Elliott
3
9
13.3
11
-2
0
1
2
2
2
Paul Menard
5
16
16.8
14.2
1.8
0
1
1
3
4
Brad Keselowski
5
13.6
16.8
14.4
-0.8
0
1
1
3
4
Jimmie Johnson
5
16.2
9.2
10
6.2
0
0
2
5
5
Avg.
Run
Avg.
Pos.
Top
Top
Top
Top
Driver
#
Start
Pos
Finish
Diff.
W
5
10
15
20
Ryan Newman
5
14.8
14.8
13.4
1.4
0
0
2
4
4
Aric Almirola
4
26.8
20.8
18
8.8
0
0
1
2
2
Erik Jones
2
25
19.5
16
9
0
0
1
1
1
Ryan Blaney
3
14.7
18.7
22
-7.3
0
0
1
1
1
Alex Bowman
3
32
27.3
23
9
0
0
1
1
1
Kyle Larson
5
2.8
13.2
19
-16.2
0
0
0
3
3
Daniel Suarez
2
13.5
17
15.5
-2
0
0
0
1
2
Chris Buescher
3
23.3
21.7
20.3
3
0
0
0
1
2
Michael McDowell
5
21.8
24.2
26.4
-4.6
0
0
0
1
1
Austin Dillon
5
26.6
19.8
18
8.6
0
0
0
0
4
Parker Kligerman
1
34
25
23
11
0
0
0
0
0
Matt DiBenedetto
4
30
27.3
25
5
0
0
0
0
1
William Byron
1
8
21
25
-17
0
0
0
0
0
Avg.
Run
Avg.
Pos.
Top
Top
Top
Top
Driver
#
Start
Pos
Finish
Diff.
W
5
10
15
20
Ricky Stenhouse Jr
5
26.2
26.2
26.6
-0.4
0
0
0
0
2
Bubba Wallace
1
35
30
29
6
0
0
0
0
0
Ty Dillon
2
33
28
30.5
2.5
0
0
0
0
0
Reed Sorenson
1
40
35
32
8
0
0
0
0
0
David Ragan
5
25.2
27
32
-6.8
0
0
0
0
0
Landon Cassill
4
36
34
34.5
1.5
0
0
0
0
0
Cody Ware
1
38
36
36
2
0
0
0
0
0
JJ Yeley
2
36.5
34.5
37.5
-1
0
0
0
0
0
Corey LaJoie
0
0
0
0
0
0
0
0
0
0
Daniel Hemric
0
0
0
0
0
0
0
0
0
0
Justin Haley
0
0
0
0
0
0
0
0
0
0
Matt Tifft
0
0
0
0
0
0
0
0
0
0
Ross Chastain
0
0
0
0
0
0
0
0
0
0
Ryan Preece
0
0
0
0
0
0
0
0
0
0
Laps
Laps Led
Fastest
Fast Laps
Top-15
Avg. Driver
Laps
Driver
#
Led
/Race
Laps
/Race
Rate
Rating
Comp.
Kevin Harvick
5
85
17
75
15
86%
115.2
550
Kyle Busch
5
22
4.4
8
1.6
71%
98.8
550
Martin Truex Jr
5
87
0
58
0
65%
102.8
447
Clint Bowyer
5
9
1.8
16
3.2
58%
86.7
445
Denny Hamlin
5
48
9.6
23
4.6
63%
90.4
550
Joey Logano
5
3
0.6
4
0.8
66%
85.4
550
Kurt Busch
5
44
8.8
33
6.6
83%
105.8
550
Chase Elliott
3
0
0
6
2
54%
87.6
220
Paul Menard
5
3
0.6
4
0.8
46%
77.1
549
Brad Keselowski
5
17
3.4
13
2.6
56%
81.7
550
Jimmie Johnson
5
58
11.6
36
7.2
87%
103.2
550
Laps
Laps Led
Fastest
Fast Laps
Top-15
Avg. Driver
Laps
Driver
#
Led
/Race
Laps
/Race
Rate
Rating
Comp.
Ryan Newman
5
0
0
3
0.6
63%
80
549
Aric Almirola
4
0
0
2
0.5
23%
68.7
440
Erik Jones
2
1
0.5
1
0.5
30%
67
219
Ryan Blaney
3
0
0
2
0.7
42%
66.5
324
Alex Bowman
3
0
0
0
0
22%
54.3
543
Kyle Larson
5
11
2.2
16
3.2
66%
82.5
549
Daniel Suarez
2
0
0
1
0.5
44%
74
220
Chris Buescher
3
4
1.3
3
1
31%
65.1
440
Michael McDowell
5
0
0
9
1.8
13%
57.3
530
Austin Dillon
5
0
0
1
0.2
24%
67.5
550
Parker Kligerman
1
0
0
0
0
4%
47.8
109
Matt DiBenedetto
4
0
0
0
0
6%
46.5
439
William Byron
1
0
0
0
0
26%
57.5
109
Laps
Laps Led
Fastest
Fast Laps
Top-15
Avg. Driver
Laps
Driver
#
Led
/Race
Laps
/Race
Rate
Rating
Comp.
Ricky Stenhouse Jr
5
0
0
1
0.2
9%
52.3
469
Bubba Wallace
1
0
0
0
0
0%
37
109
Ty Dillon
2
0
0
2
1
4%
38.6
215
Reed Sorenson
1
0
0
0
0
0%
39.1
109
David Ragan
5
0
0
1
0.2
11%
48.1
515
Landon Cassill
4
0
0
0
0
1%
33.4
347
Cody Ware
1
0
0
0
0
0%
24.2
42
JJ Yeley
2
0
0
0
0
0%
35
180
Corey LaJoie
0
0
0
0
0
0
0
0
Daniel Hemric
0
0
0
0
0
0
0
0
Justin Haley
0
0
0
0
0
0
0
0
Matt Tifft
0
0
0
0
0
0
0
0
Ross Chastain
0
0
0
0
0
0
0
0
Ryan Preece
0
0
0
0
0
0
0
0
Top-20 Drivers Over Last 10 Sonoma Races
Avg.
Run
Avg.
Pos.
Top
Top
Top
Top
Driver
#
Start
Pos
Finish
Diff.
W
5
10
15
20
Martin Truex Jr
10
8.7
13.8
19.8
-11.1
2
3
4
5
5
Clint Bowyer
10
14.9
13.7
10.7
4.2
1
6
8
8
8
Kurt Busch
10
10.7
9.5
9.2
1.5
1
4
7
9
9
Kevin Harvick
10
15
11.7
10
5
1
4
7
7
9
Jimmie Johnson
10
12.8
8.7
7.6
5.2
1
3
7
10
10
Kyle Busch
10
11.6
16.7
16.7
-5.1
1
3
4
5
6
Denny Hamlin
10
14.5
16.8
19.4
-4.9
0
3
4
4
5
Joey Logano
10
12.1
14.6
13.4
-1.3
0
2
4
6
9
Brad Keselowski
9
16.7
16.7
16.7
0
0
1
2
5
6
Avg.
Run
Avg.
Pos.
Top
Top
Top
Top
Driver
#
Start
Pos
Finish
Diff.
W
5
10
15
20
Chase Elliott
3
9
13.3
11
-2
0
1
2
2
2
Paul Menard
10
17
19.3
16.5
0.5
0
1
1
4
7
Ryan Newman
10
13.9
16.5
15.8
-1.9
0
0
2
5
8
Aric Almirola
6
28.2
21.5
20
8.2
0
0
1
2
3
Erik Jones
2
25
19.5
16
9
0
0
1
1
1
Ryan Blaney
3
14.7
18.7
22
-7.3
0
0
1
1
1
Alex Bowman
3
32
27.3
23
9
0
0
1
1
1
Kyle Larson
5
2.8
13.2
19
-16.2
0
0
0
3
3
Daniel Suarez
2
13.5
17
15.5
-2
0
0
0
1
2
Chris Buescher
3
23.3
21.7
20.3
3
0
0
0
1
2
Michael McDowell
6
24.5
25.2
27
-2.5
0
0
0
1
1
Laps
Laps Led
Fastest
Fast Laps
Top-15
Avg. Driver
Driver
#
Led
/Race
Laps
/Race
Rate
Rating
Martin Truex Jr
10
154
15.4
97
9.7
67%
100.4
Clint Bowyer
10
82
8.2
50
5
65%
95.5
Kurt Busch
10
138
13.8
76
7.6
81%
108.9
Kevin Harvick
10
90
9
80
8
70%
99.9
Jimmie Johnson
10
113
11.3
80
8
87%
109.1
Kyle Busch
10
32
3.2
21
2.1
58%
86.7
Denny Hamlin
10
93
9.3
43
4.3
50%
85.4
Joey Logano
10
18
1.8
11
1.1
60%
82.8
Brad Keselowski
9
24
2.67
21
2.33
55%
80
Laps
Laps Led
Fastest
Fast Laps
Top-15
Avg. Driver
Driver
#
Led
/Race
Laps
/Race
Rate
Rating
Chase Elliott
3
0
0
6
2
54%
87.6
Paul Menard
10
3
0.3
5
0.5
29%
70.7
Ryan Newman
10
0
0
8
0.8
49%
78.5
Aric Almirola
6
0
0
2
0.33
22%
66.6
Erik Jones
2
1
0.5
1
0.5
30%
67
Ryan Blaney
3
0
0
2
0.67
42%
66.5
Alex Bowman
3
0
0
0
0
22%
54.3
Kyle Larson
5
11
2.2
16
3.2
66%
82.5
Daniel Suarez
2
0
0
1
0.5
44%
74
Chris Buescher
3
4
1.33
3
1
31%
65.1
Michael McDowell
6
0
0
9
1.5
12%
54.9
Top-20 Drivers at Similar Races (Sonoma and Watkins Glen)
Take this stat a little less seriously this week as each road course is different.
Avg.
Run
Avg.
Pos.
Top
Top
Top
Top
Driver
#
Start
Pos
Finish
Diff.
W
5
10
15
20
Martin Truex Jr
10
8.6
11.8
14.8
-6.2
2
4
5
7
7
Kyle Busch
10
8.7
12.1
10.1
-1.4
1
5
8
8
8
Kevin Harvick
10
12.4
10.9
10.2
2.2
1
4
7
7
9
Joey Logano
10
11.9
14.7
12.5
-0.6
1
4
5
6
8
Denny Hamlin
10
12
12.9
12.9
-0.9
1
4
5
6
7
Chase Elliott
6
8.3
11.5
10
-1.7
1
2
3
5
5
Clint Bowyer
10
18.1
16.1
12.5
5.6
0
4
6
7
8
Kurt Busch
10
14.1
10.6
7.1
7.0
0
3
8
10
10
Brad Keselowski
10
12.5
14.3
14.9
-2.4
0
2
3
6
8
Daniel Suarez
4
13.3
12.5
9.5
3.8
0
2
2
3
4
Avg.
Run
Avg.
Pos.
Top
Top
Top
Top
Driver
#
Start
Pos
Finish
Diff.
W
5
10
15
20
Erik Jones
4
16.3
13.8
11.8
4.5
0
1
3
3
3
Kyle Larson
10
5.2
13.3
16.9
-11.7
0
1
2
6
6
Paul Menard
10
21.9
20.3
18.4
3.5
0
1
1
4
6
Jimmie Johnson
10
12.9
13.4
18.7
-5.8
0
0
3
6
6
Ryan Newman
10
15.4
17.5
18.3
-2.9
0
0
2
5
7
Ryan Blaney
6
15
16.3
17.5
-2.5
0
0
2
3
4
Aric Almirola
9
25
23.9
19.6
5.4
0
0
1
2
4
Alex Bowman
6
32.2
27.7
24.7
7.5
0
0
1
2
2
William Byron
2
12
15.5
16.5
-4.5
0
0
1
1
1
Chris Buescher
7
23.4
24.4
22.7
0.7
0
0
0
2
4
Laps
Laps Led
Fastest
Fast Laps
Top-15
Avg. Driver
Driver
#
Led
/Race
Laps
/Race
Rate
Rating
Martin Truex Jr
10
121
12.1
109
10.9
70%
104.4
Kyle Busch
10
81
8.1
88
8.8
74%
104
Kevin Harvick
10
114
11.4
88
8.8
76%
103.8
Joey Logano
10
12
1.2
20
2
64%
83.5
Denny Hamlin
10
60
6
27
2.7
67%
89.9
Chase Elliott
6
61
10.2
40
6.7
63%
99.1
Clint Bowyer
10
9
0.9
22
2.2
56%
83.5
Kurt Busch
10
47
4.7
40
4
81%
100.3
Brad Keselowski
10
92
9.2
50
5
64%
89.2
Daniel Suarez
4
14
3.5
2
0.5
65%
90.9
Laps
Laps Led
Fastest
Fast Laps
Top-15
Avg. Driver
Driver
#
Led
/Race
Laps
/Race
Rate
Rating
Erik Jones
4
1
0.3
2
0.5
57%
84.4
Kyle Larson
10
11
1.1
31
3.1
66%
84.3
Paul Menard
10
3
0.3
5
0.5
36%
68.6
Jimmie Johnson
10
65
6.5
40
4
70%
88.6
Ryan Newman
10
0
0
3
0.3
44%
72.7
Ryan Blaney
6
2
0.3
4
0.7
53%
74.2
Aric Almirola
9
0
0
2
0.2
12%
63.3
Alex Bowman
6
0
0
0
0
20%
51.9
William Byron
2
0
0
0
0
63%
76
Chris Buescher
7
4
0.6
3
0.4
22%
58.2
Team Averages at Sonoma (since Feb. 2017)
Avg.
Top
Top
Team
Finish
Races
Wins
5
10
Stewart-Haas Racing
5.75
8
1
4
7
Joe Gibbs Racing
10.25
8
0
3
5
Hendrick Motorsports
12.5
8
0
1
4
Team Penske
16.2
5
0
1
1
Richard Childress Racing
16.8
5
0
0
0
Leavine Family Racing
17
2
0
0
0
Wood Brothers Racing
17.5
2
0
0
1
GO FAS Racing
20
2
0
0
0
Momentum
Driver
Driver Momentum
Avg.
Run.
Avg.
Pos.
Top
Top
Top
Top
Laps
Fastest
Laps
Avg. Driver
Driver
#
Start
Pos.
Finish
Diff.
W
5
10
15
20
Led
Laps
Comp.
Rating
Martin Truex Jr
5
18.8
12.4
11.8
7
2
3
3
3
4
248
175
1364
101.8
Kyle Busch
5
10
8.8
9.8
0.2
1
3
4
4
4
160
149
1431
107.2
Joey Logano
5
11.6
11
6.4
5.2
1
2
4
5
5
179
37
1433
100.5
Brad Keselowski
5
9.4
8.8
8
1.4
1
2
3
4
5
156
74
1431
103.8
Chase Elliott
5
14.8
7.6
7.4
7.4
0
4
4
4
5
236
110
1434
109.7
Alex Bowman
5
11.6
9.2
7.2
4.4
0
2
4
5
5
87
91
1434
102.4
Clint Bowyer
5
5.6
12
15.6
-10
0
2
3
3
3
15
31
1358
90.1
Erik Jones
5
11
15.6
16.6
-5.6
0
2
3
3
3
0
32
1052
85.7
Kevin Harvick
5
5.2
8.2
11.2
-6
0
1
3
4
4
134
140
1433
112.1
Daniel Suarez
5
14.4
15
11
3.4
0
1
2
4
5
31
46
1433
79.2
Avg.
Run.
Avg.
Pos.
Top
Top
Top
Top
Laps
Fastest
Laps
Avg. Driver
Driver
#
Start
Pos.
Finish
Diff.
W
5
10
15
20
Led
Laps
Comp.
Rating
Kurt Busch
5
13.4
13
12
1.4
0
1
2
4
4
7
22
1429
85.9
Kyle Larson
5
18.4
10.8
16.8
1.6
0
1
2
3
3
35
51
1348
91.9
Ricky Stenhouse Jr
5
14.2
17.8
20
-5.8
0
1
1
2
3
11
10
1406
73.3
William Byron
5
5.6
12
12.8
-7.2
0
0
3
3
5
67
36
1433
87.5
Jimmie Johnson
5
13.2
14.6
12.4
0.8
0
0
2
4
5
4
13
1433
79.2
Chris Buescher
5
25
17.4
13.8
11.2
0
0
2
3
4
10
10
1431
74
Ryan Blaney
5
14.6
12.8
16.2
-1.6
0
0
1
4
4
3
34
1426
84.5
Aric Almirola
5
11.4
13
13.2
-1.8
0
0
1
3
5
1
27
1433
84.4
Denny Hamlin
5
9.8
14.8
14.2
-4.4
0
0
1
2
4
27
37
1430
79.2
Tyler Reddick
1
21
16
9
12
0
0
1
1
1
0
1
271
78.1
Avg.
Run.
Avg.
Pos.
Top
Top
Top
Top
Laps
Fastest
Laps
Avg. Driver
Driver
#
Start
Pos.
Finish
Diff.
W
5
10
15
20
Led
Laps
Comp.
Rating
Ryan Newman
5
19
18.2
16.2
2.8
0
0
1
1
4
0
3
1430
67.6
Paul Menard
5
13
15.8
17.2
-4.2
0
0
0
2
4
0
18
1431
73.2
Daniel Hemric
5
16.8
18.6
17.8
-1
0
0
0
2
3
10
12
1425
67.2
Corey LaJoie
5
27.8
27.4
24.4
3.4
0
0
0
1
1
0
1
1333
44.9
David Ragan
5
26
25.6
26.4
-0.4
0
0
0
1
1
3
9
1413
48.4
Michael McDowell
5
27.4
24.8
23.8
3.6
0
0
0
0
1
1
5
1424
51
Ty Dillon
5
27.8
25
24.4
3.4
0
0
0
0
0
0
2
1424
50.4
Parker Kligerman
1
34
26
26
8
0
0
0
0
0
0
5
396
49.8
Matt Tifft
5
28
27.4
26
2
0
0
0
0
1
1
3
1386
44.2
Bubba Wallace
5
23.2
25.6
26
-2.8
0
0
0
0
0
0
1
1419
51.9
Avg.
Run.
Avg.
Pos.
Top
Top
Top
Top
Laps
Fastest
Laps
Avg. Driver
Driver
#
Start
Pos.
Finish
Diff.
W
5
10
15
20
Led
Laps
Comp.
Rating
Ryan Preece
5
26.4
25.6
26.4
0
0
0
0
0
0
0
1
1366
49.7
Matt DiBenedetto
5
23
24.8
26.6
-3.6
0
0
0
0
2
0
8
1069
49.4
Austin Dillon
5
11.4
20
26.6
-15.2
0
0
0
0
2
7
6
1213
61.5
Garrett Smithley
1
36
33
30
6
0
0
0
0
0
0
0
200
28
Ross Chastain
4
32.5
30.8
30.3
2.2
0
0
0
0
0
1
3
950
38.3
Bayley Currey
3
30
31.7
31
-1
0
0
0
0
0
0
0
667
35.8
Quin Houff
5
34
33.4
31.8
2.2
0
0
0
0
0
0
2
1182
31.3
Reed Sorenson
4
34.5
33.3
32
2.5
0
0
0
0
0
0
3
1164
31.6
BJ McLeod
2
35
33
33
2
0
0
0
0
0
0
2
491
35.7
Josh Bilicki
1
34
34
33
1
0
0
0
0
0
0
0
197
27.7
Landon Cassill
5
32.4
33.2
33
-0.6
0
0
0
0
0
0
1
1113
32.4
JJ Yeley
1
37
35
34
3
0
0
0
0
0
0
0
110
28.2
Joey Gase
2
40
36.5
35
5
0
0
0
0
0
0
1
592
27.6
Kyle Weatherman
1
33
35
36
-3
0
0
0
0
0
0
0
69
26.7
Cody Ware
3
33
37.3
37.3
-4.3
0
0
0
0
0
0
0
679
27.2
Timmy Hill
1
39
39
39
0
0
0
0
0
0
0
2
257
26.5
Team
Team Momentum
Avg.
Run.
Avg.
Pos.
Top
Top
Top
Top
Laps
Fastest
Team
#
Start
Pos.
Finish
Diff.
W
5
10
15
20
Led
Laps
Chip Ganassi Racing
10
15.9
11.9
14.4
1.5
0
2
4
7
7
42
73
Front Row Motorsports
15
27.1
25.9
25.4
1.7
0
0
0
1
3
5
17
Hendrick Motorsports
20
11.3
10.9
10
1.4
0
6
13
16
20
394
250
Joe Gibbs Racing
20
12.4
12.9
13.1
-0.7
3
8
11
12
15
435
393
JTG Daugherty Racing
10
25.7
21.5
20.1
5.6
0
0
2
3
4
10
11
Richard Childress Racing
10
14.1
19.3
22.2
-8.1
0
0
0
2
5
17
18
Roush Fenway Racing
10
16.6
18
18.1
-1.5
0
1
2
3
7
11
13
Stewart-Haas Racing
20
9.2
12.1
12.8
-3.6
0
4
9
14
17
181
244
Team Penske
15
11.9
10.9
10.2
1.7
2
4
8
13
14
338
145
DraftKings Scoring Averages at Sonoma
Driver
2018
2017
2016
2015
2014
Last 2 Avg
Last 5 Avg
DK Seas. Avg.
Kevin Harvick
75.75
65.5
61.25
57.5
21.75
70.63
56.35
51.64
Martin Truex Jr
72
-12.75
43.5
-28
37
29.63
22.35
58.42
Kyle Busch
44.5
38.75
39
62.25
14
41.63
39.70
69.11
Brad Keselowski
29
67.75
26
16.5
15.5
48.38
30.95
54.49
Chase Elliott
39.5
38
18.5
38.75
32.00
49.76
Kurt Busch
55.75
50
30
62.75
26
52.88
44.90
42.79
Joey Logano
18
39
46
53
22.75
28.50
35.75
54.39
Clint Bowyer
61
54.5
-18
47.5
50.25
57.75
39.05
33.85
Denny Hamlin
49
55.25
58.75
24.5
8
52.13
39.10
40.68
Ryan Blaney
-13
33
25
10.00
15.00
37.64
Driver
2018
2017
2016
2015
2014
Last 2 Avg
Last 5 Avg
DK Seas. Avg.
Daniel Suarez
30
23.5
26.75
26.75
37.21
Kyle Larson
19.5
-2.75
26.5
20
-8.5
8.38
10.95
35.03
Jimmie Johnson
31
50.5
38
59.75
54.25
40.75
46.70
34
Erik Jones
50.75
24
37.38
37.38
27.72
Aric Almirola
52.5
19
41
27.5
52.50
35.00
34.57
Chris Buescher
45.5
17
20
31.25
27.50
30.29
Daniel Hemric
18.72
Alex Bowman
43
23
24
43.00
30.00
36.01
Ryan Newman
10
34
45
42.5
30
22.00
32.30
31.67
Driver
2018
2017
2016
2015
2014
Last 2 Avg
Last 5 Avg
DK Seas. Avg.
Paul Menard
7
37
22.25
50.5
44
22.00
32.15
28
William Byron
2
2.00
2.00
29.18
Michael McDowell
24
33
-14
-1
27.5
28.50
13.90
17.81
Austin Dillon
39
27.5
24
47
36
33.25
34.70
22.6
Ricky Stenhouse Jr
26.5
-10
19
44
6
8.25
17.10
27.21
Matt DiBenedetto
40
25
15
16
32.50
24.00
22.6
Matt Tifft
21.87
Bubba Wallace
21
21.00
21.00
19.65
Ryan Preece
21.94
Ty Dillon
9
24
16.50
16.50
27.91
Driver
2018
2017
2016
2015
2014
Last 2 Avg
Last 5 Avg
DK Seas. Avg.
David Ragan
28
10
10.5
-25
3
19.00
5.30
19.88
Ross Chastain
21.2
Parker Kligerman
32
32.00
32.00
26.57
Reed Sorenson
20
20.00
13.44
JJ Yeley
-4
15
5.50
13
Justin Haley
18
Corey LaJoie
22.12
Landon Cassill
15
23
11
-5
15.00
11.00
15.69
Cody Ware
10
10.00
10.00
10.04
FanDuel Scoring Average at Sonoma
Driver
2018
2017
2016
2015
2014
Last 2 Avg
Last 5 Avg
FD Seas. Avg.
Kevin Harvick
56.5
61.9
55.8
54.5
27.3
59.20
51.20
57.48
Martin Truex Jr
60.7
-1.9
46
-10.9
38.5
29.40
26.48
61.39
Kyle Busch
49
46.8
45.7
60.7
24.5
47.90
45.34
67.36
Brad Keselowski
37.5
60.7
35.5
28.5
25.5
49.10
37.54
61.43
Chase Elliott
47.5
44
28.5
45.75
40.00
61.77
Kurt Busch
54.6
50
39
55.3
36.5
52.30
47.08
62.13
Joey Logano
29.5
43
51
54
33.3
36.25
42.16
66.01
Clint Bowyer
57
56.5
-9.5
50.9
50
56.75
40.98
52.12
Denny Hamlin
47.9
54.1
56.3
32.5
21
51.00
42.36
57.02
Ryan Blaney
5.9
42
30.5
23.95
26.13
52.62
Driver
2018
2017
2016
2015
2014
Last 2 Avg
Last 5 Avg
FD Seas. Avg.
Daniel Suarez
37.5
33.5
35.50
35.50
56.22
Kyle Larson
31.7
14.3
36.5
31.5
11.5
23.00
25.10
49.31
Jimmie Johnson
39
45.7
40
54
52.6
42.35
46.26
54.34
Erik Jones
51.6
29.4
40.50
40.50
48.75
Aric Almirola
52
26
43.5
32
52.00
38.38
52.60
Chris Buescher
46.5
28.4
25
37.45
33.30
51.62
Daniel Hemric
44.32
Alex Bowman
47
25.9
27.5
47.00
33.47
54.67
Ryan Newman
22.9
39.5
48.5
46.5
39
31.20
39.28
55.06
Paul Menard
20.4
43
32.8
48.5
49
31.70
38.74
51.64
Driver
2018
2017
2016
2015
2014
Last 2 Avg
Last 5 Avg
FD Seas. Avg.
William Byron
18.4
18.40
18.40
50.66
Michael McDowell
31.5
39
1.6
12.4
30
35.25
22.90
38.06
Austin Dillon
41.5
34.5
31
45
39.5
38.00
38.30
46.73
Ricky Stenhouse Jr
34
-2
26.5
42
17.4
16.00
23.58
49.92
Matt DiBenedetto
41.5
31
22
23.4
36.25
29.48
44.63
Matt Tifft
41.79
Bubba Wallace
25.9
25.90
25.90
41.77
Ryan Preece
47.79
Ty Dillon
17.6
27.4
22.50
22.50
51.11
Driver
2018
2017
2016
2015
2014
Last 2 Avg
Last 5 Avg
FD Seas. Avg.
David Ragan
32.9
19.4
19
-5.2
13.4
26.15
15.90
44.19
Ross Chastain
41.31
Parker Kligerman
34.4
34.40
34.40
45.26
Reed Sorenson
23.9
23.90
38.35
JJ Yeley
4.6
20.4
12.50
19.50
Justin Haley
30.00
Corey LaJoie
44.71
Landon Cassill
22.4
27
16.4
0.9
22.40
16.68
36.70
Cody Ware
10.2
10.20
10.20
27.27
Weekly Rankings (1=Best, 40=Worst)
The Race History, Sonoma History, and Track Type History columns are based on average finish at those races. The DK and FD scoring columns are ranked from highest scoring to lowest scoring averages over those spans.