

For the second time this year, NASCAR heads to the birthplace of the sport for the third restrictor plate race of the year. The Coke Zero 400 is a 160-lap affair for a mileage total of 400 by the end of the night. Like the Daytona 500, it’s again a restrictor plate race and thus your standard pack racing and big crashes apply once again.
This week’s track breakdown data is a bit different than week’s prior because the first section of data is based off of the last four JULY races and not the last four total. The reasoning behind that is because the average finishes for each driver are substantially different in the July race than the February trip. So to get a more accurate assessment of this race, I broke down the last four 400s rather than including the 500 as well. That being said, the other sections (top-15 drivers at both the last 10 races and similar races) include both stops each year for Daytona and Talladega.
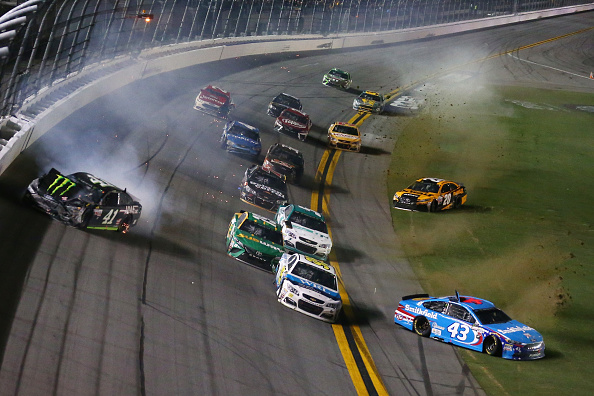
If you aren’t familiar with the term “restrictor plate” it refers to an actual metal plate that is placed inside the engine, on top of the carburetor that has holes of specific sizes in it. It is designed to reduce the horsepower of the cars and thus reduce the speeds of the cars at top speed. The reasoning behind this is due to the size and banking of Daytona and Talladega as they are 2.5 miles per lap and are banked at better than 30 degrees in the turns which allows for the carrying of speed throughout the course of a lap. Even with the plates in the engines, the cars still hit 205-210 during practice and the race, but without them they’d be going about 230 instead. The side effect of the plates is that it’s hard to pull away from the cars behind you and really get a single-car lead and with the cars going around in a pack, it means that one wiggle by one car can trigger a massive wreck at any point.
In the last 10 July races here, eight winners have come from the top-10 starting spots including three wins from the pole with the last coming in 2015. In terms of DFS points however, the best way to attack these races is to stack the lineup with guys that start in the back of the field. Seem a bit crazy not to go after top-10 guys since they win nearly all the time? Well the top-five points earners in DK over the last few July races are: Michael McDowell (61.00/race), Corey LaJoie (58.00/race), Clint Bowyer (50.25/race), Brendan Gaughan (49.50/race), Alex Bowman (48.50/race) are guys that have an average starting spot of 29, 36, 19.8, 37.5, and 40 respectively. Moving up in the field is a great way to bank points here.
Also as a programming note of sorts, there will not be practice notes this week as practice doesn’t really matter very much at Daytona, plus the practices are going on Thursday afternoon, during the publishing of this breakdown. Practice speeds will still be used, to a degree, in the playbook but only as a means of comparing them to their qualifying spots.
Track Data
Last Four July Races at Daytona International Speedway
| Avg. | Avg. | Avg. | Top | Top | Top | Top | Laps | |||
| Driver | Races | Start | Run Pos. | Finish | Wins | 5s | 10s | 15s | 20s | Led |
| Ricky Stenhouse Jr | 4 | 14 | 19.8 | 16.5 | 1 | 2 | 2 | 2 | 3 | 17 |
| Aric Almirola | 3 | 21.7 | 16.3 | 16.7 | 1 | 1 | 1 | 2 | 2 | 14 |
| Brad Keselowski | 4 | 16.5 | 16 | 19.8 | 1 | 1 | 1 | 1 | 2 | 150 |
| Kurt Busch | 4 | 23.3 | 13.3 | 14.8 | 0 | 2 | 2 | 2 | 2 | 36 |
| Clint Bowyer | 4 | 19.8 | 18.8 | 7.5 | 0 | 1 | 4 | 4 | 4 | 7 |
| Austin Dillon | 4 | 12.5 | 18.8 | 13.8 | 0 | 1 | 3 | 3 | 3 | 8 |
| Michael McDowell | 3 | 29 | 18.3 | 7 | 0 | 1 | 3 | 3 | 3 | 0 |
| Denny Hamlin | 4 | 24.8 | 11.5 | 12.5 | 0 | 1 | 2 | 2 | 3 | 33 |
| Ryan Newman | 4 | 20.5 | 26.3 | 13.8 | 0 | 1 | 2 | 2 | 3 | 1 |
| Trevor Bayne | 4 | 14.3 | 20.8 | 18.3 | 0 | 1 | 2 | 2 | 2 | 2 |
| Jimmie Johnson | 4 | 9.3 | 17.3 | 22.8 | 0 | 1 | 1 | 2 | 2 | 39 |
| Kyle Busch | 4 | 17.8 | 18.5 | 16.8 | 0 | 1 | 1 | 1 | 3 | 16 |
| Paul Menard | 4 | 19 | 17 | 17.8 | 0 | 1 | 1 | 1 | 3 | 0 |
| Joey Logano | 4 | 19.8 | 18.8 | 19.5 | 0 | 1 | 1 | 1 | 2 | 6 |
| Kevin Harvick | 4 | 18.3 | 25.8 | 28.8 | 0 | 1 | 1 | 1 | 1 | 11 |
| David Ragan | 4 | 21 | 15.3 | 14 | 0 | 0 | 1 | 2 | 3 | 12 |
| AJ Allmendinger | 4 | 21 | 27.8 | 21.3 | 0 | 0 | 1 | 2 | 2 | 0 |
| Erik Jones | 1 | 17 | 13 | 9 | 0 | 0 | 1 | 1 | 1 | 9 |
| Chris Buescher | 2 | 27 | 24.5 | 25 | 0 | 0 | 1 | 1 | 1 | 1 |
| Brendan Gaughan | 2 | 37.5 | 26.5 | 17.5 | 0 | 0 | 1 | 1 | 1 | 0 |
| Kyle Larson | 4 | 22.3 | 23 | 27.5 | 0 | 0 | 1 | 1 | 1 | 0 |
| Jamie McMurray | 4 | 20.5 | 15 | 23.3 | 0 | 0 | 0 | 2 | 2 | 11 |
| Landon Cassill | 4 | 21.3 | 22 | 23.5 | 0 | 0 | 0 | 1 | 2 | 0 |
| Ryan Blaney | 2 | 10.5 | 11.5 | 20 | 0 | 0 | 0 | 1 | 1 | 9 |
| Matt DiBenedetto | 3 | 35 | 24.3 | 24 | 0 | 0 | 0 | 1 | 1 | 1 |
| Martin Truex Jr | 4 | 19.5 | 22.8 | 29 | 0 | 0 | 0 | 1 | 1 | 1 |
| Corey LaJoie | 1 | 36 | 23 | 11 | 0 | 0 | 0 | 1 | 1 | 0 |
| Darrell Wallace Jr | 1 | 31 | 17 | 15 | 0 | 0 | 0 | 1 | 1 | 0 |
| Alex Bowman | 2 | 40 | 25 | 18.5 | 0 | 0 | 0 | 1 | 1 | 0 |
| Kasey Kahne | 4 | 11.5 | 14.3 | 26.8 | 0 | 0 | 0 | 0 | 1 | 17 |
| Daniel Suarez | 1 | 20 | 14 | 17 | 0 | 0 | 0 | 0 | 1 | 11 |
| Ty Dillon | 1 | 34 | 14 | 16 | 0 | 0 | 0 | 0 | 1 | 7 |
| Chase Elliott | 2 | 13 | 19 | 27 | 0 | 0 | 0 | 0 | 0 | 4 |
| Reed Sorenson | 3 | 26 | 27 | 28.3 | 0 | 0 | 0 | 0 | 0 | 4 |
| Ray Black Jr. | 0 | 0 | 0 | 0 | 0 | 0 | 0 | 0 | 0 | 0 |
| Joey Gase | 0 | 0 | 0 | 0 | 0 | 0 | 0 | 0 | 0 | 0 |
| Timothy Peters | 0 | 0 | 0 | 0 | 0 | 0 | 0 | 0 | 0 | 0 |
| Ross Chastain | 0 | 0 | 0 | 0 | 0 | 0 | 0 | 0 | 0 | 0 |
| JJ Yeley | 1 | 39 | 29 | 33 | 0 | 0 | 0 | 0 | 0 | 0 |
| Jeffrey Earnhardt | 1 | 39 | 36 | 37 | 0 | 0 | 0 | 0 | 0 | 0 |
| DJ Kennington | 1 | 40 | 36 | 38 | 0 | 0 | 0 | 0 | 0 | 0 |
| Fast | Top 15 | Avg. | High | Low | Pos | Laps Led | High to | Low to | |
| Driver | Laps | Rate | Rating | Rating | Rating | Diff | Pts./Race | Avg Rating | Avg Rating |
| Ricky Stenhouse Jr | 16 | 41% | 72.4 | 100.7 | 34.1 | -2.50 | 1.06 | 28.3 | 38.3 |
| Aric Almirola | 9 | 53% | 79.6 | 111.4 | 58.9 | 5.00 | 1.17 | 31.8 | 20.7 |
| Brad Keselowski | 9 | 54% | 87 | 132.4 | 54.8 | -3.30 | 9.38 | 45.4 | 32.2 |
| Kurt Busch | 10 | 65% | 89.4 | 120.8 | 75.9 | 8.50 | 2.25 | 31.4 | 13.5 |
| Clint Bowyer | 10 | 45% | 80.5 | 104 | 61.4 | 12.30 | 0.44 | 23.5 | 19.1 |
| Austin Dillon | 11 | 48% | 76.4 | 90.7 | 43.1 | -1.30 | 0.50 | 14.3 | 33.3 |
| Michael McDowell | 13 | 41% | 71.8 | 78.3 | 60.2 | 22.00 | 0.00 | 6.5 | 11.6 |
| Denny Hamlin | 5 | 72% | 89.3 | 104.5 | 72.3 | 12.30 | 2.06 | 15.2 | 17 |
| Ryan Newman | 13 | 9% | 57.1 | 59.8 | 51.5 | 6.70 | 0.06 | 2.7 | 5.6 |
| Trevor Bayne | 7 | 39% | 68.3 | 85.8 | 33.8 | -4.00 | 0.13 | 17.5 | 34.5 |
| Jimmie Johnson | 8 | 57% | 81.4 | 111.6 | 48.3 | -13.50 | 2.44 | 30.2 | 33.1 |
| Kyle Busch | 15 | 47% | 75.2 | 105.2 | 54.6 | 1.00 | 1.00 | 30 | 20.6 |
| Paul Menard | 9 | 52% | 79.4 | 86 | 72.9 | 1.20 | 0.00 | 6.6 | 6.5 |
| Joey Logano | 21 | 49% | 78 | 107.1 | 49.1 | 0.30 | 0.38 | 29.1 | 28.9 |
| Kevin Harvick | 8 | 27% | 65 | 94.3 | 32 | -10.50 | 0.69 | 29.3 | 33 |
| David Ragan | 9 | 53% | 79.1 | 96.2 | 64.7 | 7.00 | 0.75 | 17.1 | 14.4 |
| AJ Allmendinger | 7 | 13% | 53.7 | 65.8 | 29.4 | -0.30 | 0.00 | 12.1 | 24.3 |
| Erik Jones | 3 | 59% | 83.9 | 83.9 | 83.9 | 8.00 | 2.25 | 0 | 0 |
| Chris Buescher | 5 | 28% | 62.9 | 67 | 58.8 | 2.00 | 0.13 | 4.1 | 4.1 |
| Brendan Gaughan | 10 | 11% | 57.7 | 72.9 | 42.5 | 20.00 | 0.00 | 15.2 | 15.2 |
| Kyle Larson | 7 | 33% | 66.7 | 90.8 | 27.4 | -5.20 | 0.00 | 24.1 | 39.3 |
| Jamie McMurray | 8 | 59% | 86 | 90.5 | 81 | -2.80 | 0.69 | 4.5 | 5 |
| Landon Cassill | 12 | 35% | 63.7 | 88.5 | 30.9 | -2.20 | 0.00 | 24.8 | 32.8 |
| Ryan Blaney | 8 | 75% | 93.8 | 95.2 | 92.4 | -9.50 | 1.13 | 1.4 | 1.4 |
| Matt DiBenedetto | 4 | 11% | 57.9 | 60.4 | 54.2 | 11.00 | 0.08 | 2.5 | 3.7 |
| Martin Truex Jr | 5 | 28% | 64.5 | 83.2 | 41 | -9.50 | 0.06 | 18.7 | 23.5 |
| Corey LaJoie | 0 | 24% | 60.2 | 60.2 | 60.2 | 25.00 | 0.00 | 0 | 0 |
| Darrell Wallace Jr | 3 | 42% | 75.1 | 75.1 | 75.1 | 16.00 | 0.00 | 0 | 0 |
| Alex Bowman | 6 | 12% | 56.5 | 60.2 | 52.8 | 21.50 | 0.00 | 3.7 | 3.7 |
| Kasey Kahne | 0 | 63% | 83.4 | 98 | 67 | -15.30 | 1.06 | 14.6 | 16.4 |
| Daniel Suarez | 5 | 55% | 70.6 | 70.6 | 70.6 | 3.00 | 2.75 | 0 | 0 |
| Ty Dillon | 3 | 63% | 84.3 | 84.3 | 84.3 | 18.00 | 1.75 | 0 | 0 |
| Chase Elliott | 14 | 39% | 63 | 77.4 | 48.6 | -14.00 | 0.50 | 14.4 | 14.4 |
| Reed Sorenson | 4 | 14% | 48.7 | 74.3 | 34.9 | -2.30 | 0.33 | 25.6 | 13.8 |
| Ray Black Jr. | 0 | 0% | 0 | 0 | 0 | 0.00 | 0 | 0 | |
| Joey Gase | 0 | 0% | 0 | 0 | 0 | 0.00 | 0 | 0 | |
| Timothy Peters | 0 | 0% | 0 | 0 | 0 | 0.00 | 0 | 0 | |
| Ross Chastain | 0 | 0% | 0 | 0 | 0 | 0.00 | 0 | 0 | |
| JJ Yeley | 1 | 4% | 46.4 | 46.4 | 46.4 | 6.00 | 0.00 | 0 | 0 |
| Jeffrey Earnhardt | 0 | 0% | 27.1 | 27.1 | 27.1 | 2.00 | 0.00 | 0 | 0 |
| DJ Kennington | 0 | 0% | 25.8 | 25.8 | 25.8 | 2.00 | 0.00 | 0 | 0 |
Top-15 Drivers Over The Last 10 Races At Daytona
| Avg. | Avg. | Avg. | Top | Top | Top | Top | Laps | |||
| Driver | Races | Start | Run Pos. | Finish | Wins | 5s | 10s | 15s | 20s | Led |
| Denny Hamlin | 10 | 18.6 | 12.1 | 11.3 | 1 | 5 | 6 | 6 | 8 | 190 |
| Jimmie Johnson | 10 | 16.4 | 16.2 | 19 | 1 | 4 | 4 | 5 | 6 | 212 |
| Joey Logano | 10 | 16.2 | 15.4 | 14.6 | 1 | 3 | 5 | 6 | 7 | 58 |
| Kurt Busch | 9 | 16.7 | 12 | 13.7 | 1 | 3 | 5 | 5 | 5 | 68 |
| Austin Dillon | 9 | 14 | 18 | 11.9 | 1 | 2 | 6 | 7 | 8 | 18 |
| Ricky Stenhouse Jr | 10 | 18.2 | 19.7 | 19.5 | 1 | 2 | 3 | 4 | 5 | 28 |
| Aric Almirola | 9 | 25 | 19.3 | 18.8 | 1 | 2 | 2 | 6 | 6 | 22 |
| Brad Keselowski | 10 | 21.6 | 15.5 | 22.3 | 1 | 2 | 2 | 2 | 4 | 166 |
| Kevin Harvick | 10 | 16.8 | 19.8 | 19 | 0 | 4 | 4 | 5 | 5 | 61 |
| Clint Bowyer | 10 | 15.8 | 21.8 | 16.3 | 0 | 2 | 6 | 7 | 7 | 7 |
| Paul Menard | 10 | 19.9 | 18.3 | 20 | 0 | 2 | 3 | 3 | 6 | 30 |
| Kyle Busch | 9 | 16.2 | 17.9 | 18.2 | 0 | 2 | 2 | 3 | 6 | 101 |
| Michael McDowell | 8 | 28 | 21.5 | 16.6 | 0 | 1 | 4 | 6 | 6 | 0 |
| Ryan Newman | 10 | 20.9 | 24.5 | 16.5 | 0 | 1 | 4 | 5 | 6 | 2 |
| AJ Allmendinger | 10 | 26 | 25.4 | 20 | 0 | 1 | 3 | 4 | 5 | 5 |
| Fast | Top 15 | Laps | Avg. | High | Low | Pos. | Laps Led | Rating | |
| Driver | Laps | Rate | Comp. | Rating | Rating | Rating | Diff. | Pts/Race | Range |
| Denny Hamlin | 27 | 71% | 1622 | 95.3 | 139.1 | 59.6 | 7.30 | 4.75 | 79.5 |
| Jimmie Johnson | 25 | 59% | 406 | 87.6 | 140.7 | 48.3 | -2.60 | 5.30 | 92.4 |
| Joey Logano | 50 | 63% | 1620 | 90.8 | 125.3 | 49.1 | 1.60 | 1.45 | 76.2 |
| Kurt Busch | 33 | 71% | 1545 | 94 | 120.8 | 75.9 | 3.00 | 1.89 | 44.9 |
| Austin Dillon | 41 | 49% | 1513 | 77.5 | 90.7 | 43.1 | 2.10 | 0.50 | 47.6 |
| Ricky Stenhouse Jr | 40 | 37% | 1616 | 74.2 | 100.7 | 34.1 | -1.30 | 0.70 | 66.6 |
| Aric Almirola | 32 | 40% | 1492 | 74.6 | 111.4 | 58.9 | 6.20 | 0.61 | 52.5 |
| Brad Keselowski | 27 | 57% | 1510 | 86.4 | 132.4 | 54.8 | -0.70 | 4.15 | 77.6 |
| Kevin Harvick | 26 | 47% | 1467 | 81.9 | 116.3 | 32 | -2.20 | 1.53 | 84.3 |
| Clint Bowyer | 37 | 33% | 1621 | 70 | 104 | 41 | -0.50 | 0.18 | 63 |
| Paul Menard | 35 | 51% | 1542 | 77.4 | 92.9 | 46.3 | -0.10 | 0.75 | 46.6 |
| Kyle Busch | 31 | 51% | 1446 | 81.2 | 117.2 | 49.2 | -2.00 | 2.81 | 68 |
| Michael McDowell | 41 | 34% | 1279 | 66.1 | 81.4 | 24.9 | 11.40 | 0.00 | 56.5 |
| Ryan Newman | 41 | 19% | 1734 | 60.7 | 90.9 | 43.2 | 4.40 | 0.05 | 47.7 |
| AJ Allmendinger | 45 | 20% | 1657 | 59.7 | 81.3 | 29.4 | 6.00 | 0.13 | 51.9 |
Top-15 Drivers At Similar Races (last 20)
| Avg. | Avg. | Avg. | Top | Top | Top | Top | Laps | |||
| Driver | Races | Start | Run Pos. | Finish | Wins | 5s | 10s | 15s | 20s | Led |
| Joey Logano | 20 | 16.5 | 14.1 | 15.1 | 4 | 7 | 9 | 11 | 13 | 300 |
| Brad Keselowski | 20 | 15.1 | 15.4 | 19.9 | 4 | 6 | 7 | 7 | 9 | 374 |
| Denny Hamlin | 20 | 17.2 | 13.5 | 14.1 | 2 | 7 | 10 | 12 | 15 | 288 |
| Ricky Stenhouse Jr | 19 | 15.7 | 18.1 | 15.6 | 2 | 6 | 9 | 10 | 12 | 67 |
| Kurt Busch | 19 | 15.1 | 12.3 | 13.1 | 1 | 5 | 11 | 12 | 13 | 81 |
| Jimmie Johnson | 20 | 14.1 | 12.9 | 18 | 1 | 5 | 6 | 9 | 11 | 432 |
| Aric Almirola | 19 | 23.6 | 19.9 | 17.1 | 1 | 4 | 6 | 12 | 13 | 31 |
| Austin Dillon | 19 | 15.2 | 19.2 | 16.9 | 1 | 3 | 8 | 12 | 13 | 19 |
| Jamie McMurray | 20 | 20.9 | 18.3 | 20.4 | 1 | 3 | 4 | 8 | 11 | 53 |
| Kevin Harvick | 20 | 18 | 17 | 15.5 | 0 | 5 | 9 | 13 | 14 | 119 |
| Kyle Busch | 18 | 18.1 | 17.7 | 17.1 | 0 | 5 | 5 | 9 | 12 | 188 |
| Clint Bowyer | 20 | 19 | 22.3 | 16.1 | 0 | 4 | 11 | 13 | 14 | 21 |
| Paul Menard | 20 | 16.9 | 16.6 | 17.3 | 0 | 4 | 8 | 10 | 13 | 51 |
| Ryan Newman | 20 | 19 | 25.2 | 14.7 | 0 | 3 | 9 | 12 | 14 | 20 |
| Martin Truex Jr | 20 | 18.5 | 18.6 | 22.1 | 0 | 2 | 5 | 8 | 10 | 13 |
| Fast | Top 15 | Laps | Avg. | High | Low | Pos | Laps Led | Rating | |
| Driver | Laps | Rate | Comp. | Rating | Rating | Rating | Diff. | Pts./Race | Range |
| Joey Logano | 83 | 66% | 3474 | 93.5 | 132 | 44.3 | 1.40 | 3.75 | 87.7 |
| Brad Keselowski | 60 | 60% | 3311 | 89.1 | 132.4 | 32.6 | -4.80 | 4.68 | 99.8 |
| Denny Hamlin | 61 | 66% | 3406 | 92.4 | 139.1 | 59.6 | 3.10 | 3.60 | 79.5 |
| Ricky Stenhouse Jr | 86 | 43% | 3306 | 77.9 | 105.5 | 34.1 | 0.10 | 0.88 | 71.4 |
| Kurt Busch | 65 | 71% | 3415 | 93.7 | 120.8 | 75.9 | 2.00 | 1.07 | 44.9 |
| Jimmie Johnson | 47 | 70% | 797 | 93.3 | 140.7 | 48.3 | -3.90 | 5.40 | 92.4 |
| Aric Almirola | 59 | 37% | 3357 | 72.6 | 111.4 | 56.3 | 6.50 | 0.41 | 55.1 |
| Austin Dillon | 87 | 41% | 3319 | 73.8 | 90.7 | 43.1 | -1.70 | 0.25 | 47.6 |
| Jamie McMurray | 60 | 52% | 1130 | 77.8 | 115.2 | 32.4 | 0.50 | 0.66 | 82.8 |
| Kevin Harvick | 62 | 54% | 3356 | 86 | 116.3 | 32 | 2.50 | 1.49 | 84.3 |
| Kyle Busch | 65 | 54% | 3093 | 82.9 | 117.2 | 31.1 | 1.00 | 2.61 | 86.1 |
| Clint Bowyer | 105 | 33% | 3466 | 70.8 | 104 | 41 | 2.90 | 0.26 | 63 |
| Paul Menard | 90 | 54% | 3406 | 80.2 | 98.9 | 46.3 | -0.40 | 0.64 | 52.6 |
| Ryan Newman | 89 | 16% | 3619 | 60.5 | 90.9 | 43.2 | 4.30 | 0.25 | 47.7 |
| Martin Truex Jr | 47 | 51% | 3058 | 76.9 | 114.4 | 27.3 | -3.60 | 0.16 | 87.1 |
Momentum
| Avg. | Avg. | Avg. | Top | Top | Top | Top | Pos | Avg. | |||
| Driver | Races | Start | Run Pos. | Finish | Wins | 5s | 10s | 15s | 20s | Diff. | Rating |
| Kyle Busch | 5 | 6.8 | 6.2 | 2.8 | 2 | 5 | 5 | 5 | 5 | 4 | 118.5 |
| Martin Truex Jr | 5 | 14.8 | 7 | 5.2 | 2 | 4 | 4 | 4 | 5 | 9.6 | 114.3 |
| Clint Bowyer | 5 | 14.6 | 8.6 | 8.2 | 1 | 3 | 3 | 4 | 5 | 6.4 | 106 |
| Kevin Harvick | 5 | 12.4 | 9 | 10.2 | 0 | 4 | 4 | 4 | 4 | 2.2 | 118.6 |
| Brad Keselowski | 5 | 8.2 | 9 | 7.4 | 0 | 2 | 4 | 5 | 5 | 0.8 | 100.8 |
| Kyle Larson | 5 | 13.8 | 10.2 | 10.6 | 0 | 2 | 3 | 4 | 4 | 3.2 | 101.2 |
| Chase Elliott | 5 | 10.4 | 9.6 | 10.6 | 0 | 1 | 3 | 4 | 5 | -0.2 | 93.7 |
| Denny Hamlin | 5 | 16.2 | 11 | 13.4 | 0 | 1 | 3 | 4 | 4 | 2.8 | 92.7 |
| Kurt Busch | 5 | 10 | 9.2 | 10.6 | 0 | 1 | 3 | 3 | 5 | -0.6 | 98.4 |
| Jimmie Johnson | 5 | 20.6 | 13.8 | 11.6 | 0 | 1 | 2 | 4 | 5 | 9 | 85.9 |
| Paul Menard | 5 | 13 | 16.6 | 13.8 | 0 | 1 | 1 | 4 | 4 | -0.8 | 74.4 |
| Joey Logano | 5 | 7.6 | 13 | 13 | 0 | 0 | 3 | 3 | 4 | -5.4 | 85.5 |
| Alex Bowman | 5 | 18.8 | 14.4 | 14.2 | 0 | 0 | 3 | 3 | 4 | 4.6 | 77.8 |
| Aric Almirola | 5 | 15.8 | 12.8 | 12.8 | 0 | 0 | 2 | 4 | 4 | 3 | 93.7 |
| Jamie McMurray | 5 | 10.2 | 16.8 | 16 | 0 | 0 | 2 | 4 | 4 | -5.8 | 79.5 |
Points Changes at July Daytona Speedway Race
DraftKings
| 17 Race | Season | DK Pts +/- | |
| Driver | Total | Avg DK Pts. | Season AVG |
| David Ragan | 65.00 | 22.68 | 42.3 |
| Corey LaJoie | 58.00 | 17.3 | 40.7 |
| Brendan Gaughan | 66.00 | 27.92 | 38.1 |
| Paul Menard | 63.00 | 25.74 | 37.3 |
| Michael McDowell | 62.00 | 25.21 | 36.8 |
| Ryan Newman | 57.00 | 21.99 | 35.0 |
| Ricky Stenhouse Jr | 58.75 | 26.48 | 32.3 |
| AJ Allmendinger | 55.50 | 27.15 | 28.4 |
| Matt DiBenedetto | 50.50 | 22.34 | 28.2 |
| Chris Buescher | 53.00 | 26.43 | 26.6 |
| Ty Dillon | 49.25 | 22.87 | 26.4 |
| Darrell Wallace Jr | 46.50 | 24 | 22.5 |
| Erik Jones | 46.75 | 28.88 | 17.9 |
| Landon Cassill | 33.00 | 20.41 | 12.6 |
| Daniel Suarez | 35.25 | 27.16 | 8.1 |
| Clint Bowyer | 52.50 | 47.83 | 4.7 |
| Jamie McMurray | 26.50 | 23.94 | 2.6 |
| Jimmie Johnson | 35.00 | 34.72 | 0.3 |
| Trevor Bayne | 12.50 | 18 | -5.5 |
| Jeffrey Earnhardt | 9.00 | 17.21 | -8.2 |
| Kasey Kahne | 15.00 | 24.99 | -10.0 |
| DJ Kennington | 8.00 | 24.57 | -16.6 |
| Denny Hamlin | 18.00 | 42.58 | -24.6 |
| Chase Elliott | 7.50 | 35.64 | -28.1 |
| Ryan Blaney | 4.25 | 34.91 | -30.7 |
| Kurt Busch | 4.00 | 36.92 | -32.9 |
| Kyle Larson | 9.50 | 43.12 | -33.6 |
| Austin Dillon | -8.50 | 26.79 | -35.3 |
| Martin Truex Jr | 1.50 | 45.96 | -44.5 |
| Kyle Busch | 22.00 | 66.62 | -44.6 |
| Brad Keselowski | -5.75 | 39.11 | -44.9 |
| Joey Logano | -17.50 | 42.04 | -59.5 |
| Kevin Harvick | -14.75 | 69.34 | -84.1 |
| Avg. +/- | 28.6 |
FanDuel
| 17 Race | 18 Season | FD Pts +/- | |
| Driver | Total | Avg FD Pts. | Season AVG |
| Corey LaJoie | 58.8 | 28.51 | 30.29 |
| Brendan Gaughan | 62.8 | 36.83 | 25.97 |
| Michael McDowell | 62.8 | 40.76 | 22.04 |
| David Ragan | 63.7 | 43.79 | 19.91 |
| Paul Menard | 64.8 | 47.46 | 17.34 |
| Ryan Newman | 60.8 | 43.58 | 17.22 |
| Ricky Stenhouse Jr | 63.5 | 47.28 | 16.22 |
| Chris Buescher | 56.8 | 44.55 | 12.25 |
| AJ Allmendinger | 58.8 | 46.92 | 11.88 |
| Matt DiBenedetto | 51.8 | 42.89 | 8.91 |
| Ty Dillon | 51 | 43.28 | 7.72 |
| Darrell Wallace Jr | 50.3 | 46.06 | 4.24 |
| Erik Jones | 53.2 | 49.07 | 4.13 |
| Landon Cassill | 41.8 | 41.20 | 0.60 |
| Clint Bowyer | 61.2 | 61.48 | -0.28 |
| Daniel Suarez | 42.9 | 47.06 | -4.16 |
| Jamie McMurray | 40.3 | 45.29 | -4.99 |
| Jimmie Johnson | 45.7 | 51.48 | -5.78 |
| Kasey Kahne | 33.5 | 43.00 | -9.50 |
| Trevor Bayne | 29.7 | 42.54 | -12.84 |
| Ryan Blaney | 22.8 | 48.15 | -25.35 |
| Denny Hamlin | 31.3 | 57.80 | -26.50 |
| Jeffrey Earnhardt | 10.7 | 37.46 | -26.76 |
| Chase Elliott | 25.6 | 52.94 | -27.34 |
| Kyle Busch | 35.3 | 66.41 | -31.11 |
| Kyle Larson | 23.3 | 55.04 | -31.74 |
| Kurt Busch | 21.8 | 53.60 | -31.80 |
| DJ Kennington | 5.4 | 44.88 | -39.48 |
| Brad Keselowski | 10.8 | 52.71 | -41.91 |
| Austin Dillon | 3.5 | 47.38 | -43.88 |
| Martin Truex Jr | 9.8 | 57.13 | -47.33 |
| Kevin Harvick | 5.2 | 63.79 | -58.59 |
| Joey Logano | -0.9 | 60.30 | -61.20 |
| Avg. +/- | 22.10 |
Top-10 and Bottom-10 Driver Values This Week
DraftKings
| Rank | Driver | Value | Rank | Driver | Value |
|---|---|---|---|---|---|
| 1 | Kevin Harvick | 6.87 | 40 | Trevor Bayne | 2.65 |
| 2 | Kyle Busch | 6.66 | 39 | Ricky Stenhouse Jr | 2.94 |
| 3 | Timothy Peters | 6.08 | 38 | Jamie McMurray | 2.99 |
| 4 | Clint Bowyer | 5.76 | 37 | Ryan Newman | 3.10 |
| 5 | D.J. Kennington | 5.46 | 36 | William Byron | 3.13 |
| 6 | Brendan Gaughan | 5.08 | 35 | JJ Yeley | 3.19 |
| 7 | Martin Truex Jr | 4.79 | 34 | Austin Dillon | 3.43 |
| 8 | Aric Almirola | 4.68 | 33 | David Ragan | 3.44 |
| 9 | Kyle Larson | 4.59 | 32 | Paul Menard | 3.48 |
| 10 | Joey Gase | 4.58 | 31 | Corey Lajoie | 3.53 |
FanDuel
| Rank | Driver | Value | Rank | Driver | Value |
|---|---|---|---|---|---|
| 1 | D.J. Kennington | 8.98 | 40 | Ryan Blaney | 4.30 |
| 2 | Landon Cassill | 8.24 | 39 | Brad Keselowski | 4.32 |
| 3 | Timothy Peters | 8.24 | 38 | Ricky Stenhouse Jr. | 4.73 |
| 4 | Ross Chastain | 8.14 | 37 | Kurt Busch | 4.96 |
| 5 | David Ragan | 7.96 | 36 | Denny Hamlin | 5.03 |
| 6 | Ty Dillon | 7.87 | 35 | Joey Logano | 5.11 |
| 7 | J.J. Yeley | 7.54 | 34 | Austin Dillon | 5.15 |
| 8 | Jeffrey Earnhardt | 7.49 | 33 | Chase Elliott | 5.19 |
| 9 | Brendan Gaughan | 7.37 | 32 | Paul Menard | 5.27 |
| 10 | Joey Gase | 7.21 | 31 | Kevin Harvick | 5.32 |
Drivers To Watch This Week:
Ricky Stenhouse Jr.: Stenhouse was the winner of this race a year ago and has another top-five finish in the last four July races here too. There are 17 laps led and 16 fastest laps to his credit, which may not sound like a lot but the fastest laps are actually second in the field in that time. The downside is that Roush Fenway has been struggling this year as a team and even brought Matt Kenseth back into the fold to try and sort it out, so there is risk to Stenhouse despite the win and good showings at Restrictor Plate tracks in general.
Brad Keselowski: Come to a plate race and Keselowski’s price goes up, but this week it’s gone all the way to the top of the list on both sites. Brad has won four of the last 20 plate races all told, tied with his teammate Joey Logano for most in that span, including this race in 2016. That is his only top-15 finish in the last four July races but he does have two top-20s and 150 laps led. Since 2011, the last seven July races here, his average finish is 17.6 with his win being the only top-five finish. The top pricing this week is strictly based on his general aptitude at this type of track, but at this particular race it’s overrated.
Kurt Busch: Kurt continues to be an overlooked driver this year and that remains the case this week at Daytona. He is a mid-tire priced driver on DK and an upper mid-tier on FD despite a solid record in July races. Two top-fives, 36 laps led, 10 fastest laps are the stats in the last four. Over the last 10 he has a win, last year’s Daytona 500, three top-fives, five top-10s, and 68 laps led with 33 fastest laps. Busch’s 14.8 average finish in the last four is one of the best in the field and his 89.4 average Driver Rating is the best in the field among drivers with three or more races in that span, and second only to Ryan Blaney’s 93.8 in his two July races.
Clint Bowyer: Bowyer has five-straight top-10s in the July race at Daytona, the only one to manage that or more than three-straight for that matter. He finished second in this race last year and his 7.5 average finish is the best in the field among those with at least four races here. His two wins this season show he’s on top of his game this season to this point and with the speed SHR has shown week in and week out, starting with Daytona to start the year, it’s hard to look past Bowyer this week.
Aric Almirola: Almirola won this race in July of 2014 and has two top-15s in the last three trips here in July, with last year’s race being missed due to his broken back. There are 14 laps led and nine fastest laps on the record too. Also not to mention he was leading the Daytona 500 on the backstretch of the final lap in February before being spun out in front of the pack. Almirola is coming off a career day at Chicago, leading more laps in that race than the last five years combined, and could be a sneaky pick this week again.
Michael McDowell: Usually budget guys don’t make this section for the week, but McDowell is a special case given his record. In the three July races he’s run since 2015, he’s finished in the top-10 each time and in the top-five once. There are no laps led, but there are 13 fastest laps in there. McDowell’s average start of 29th in that span means that his average finish of 7th looks even better when it comes with 22 position differential points attached to it aside from the finishing points he gets too. For less than $6K on DK and $6,200 on FD it’s hard to beat that upside heading into a race.