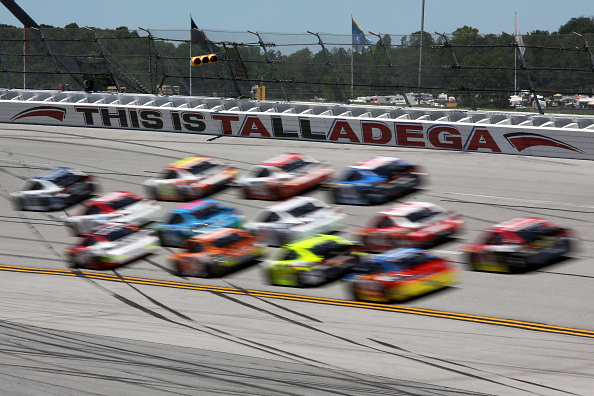

Who’s ready for ‘Dega? Ready for side-by-side pack racing? Ready for speeds over 200 mph? And of course “The Big One?” All of that will be present this week as NASCAR hits the biggest track on the schedule for the first time this year. The track, just outside of Talladega, Alabama, is widely-known as the wildest track on the circuit, even more so than it’s fellow restrictor plate track in Daytona, simply because of the width of the track and the banking and the overall speed carried throughout.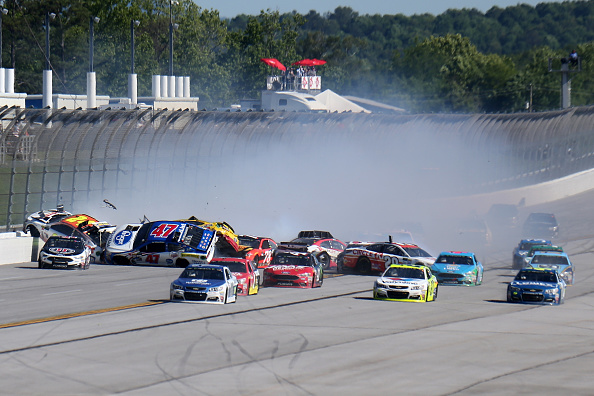
It is a tri-oval layout that is 2.66 miles per lap with banking in the turns of nearly 33-degrees in all four. The front stretch is also banked at 16.5-degrees while the backstretch is nearly flat at just 3-degrees of banking. The asphalt surface is wide enough that the pack will be four-wide at times, though that won’t last for long and isn’t recommended, and three-wide for a good chunk as well. The biggest area of concern on the track for accidents is coming off of Turn 2 and onto the flat backstretch where the transition from the banking can be hazardous to the aero of the cars, especially in packs. Every ‘Dega race has a “Big One” that involves 10 or more cars in one incident, and can get up to 20 (though rare). You will notice below that there are a lot of cars that move backwards, quite prodigiously, with 10 drivers having position differentials of -7 or greater in the last four races. That being said however, there are nearly the same amount of drivers, nine, that have PDs of +7 or greater in that same span. That’s all thanks to the numerous crashes that occur here each race.
A content note here for a minute. This week FanDuel announced that they are launching a DFS NASCAR game as well. It is up and running for this week’s race. The scoring is a bit different than DraftKings, as are the salaries and driver requirements. All-in-all I think it will be a fun new addition to the DFS realm and I will have coverage for FD in this, and each article after this, as well as a strategy breakdown for it in this week’s playbook (coming on Saturday). It will take a few weeks, and a run of more normal tracks, before I come out with lineups for FD games, but I will have lineup tips in the Optimal Lineups piece each Saturday. Going forward, in the track breakdown, the Pass Diff. column has been changed to the Laps Comp. (completed) column because FanDuel counts laps completed for points.
Also for this week, there will be no practice notes, as practice doesn’t really matter all that much when it comes to restrictor plate tracks (Talladega and Daytona). I will still reference the general speed the cars are showing in the playbook analysis however.
Now on to the data:
Track Data
Last Four Races at Talladega
| Avg. | Avg. | Avg. | Top | Top | Top | Top | Laps | |||
| Driver | Races | Start | Run Pos. | Finish | Wins | 5s | 10s | 15s | 20s | Led |
| Brad Keselowski | 4 | 4.50 | 9 | 11.8 | 2 | 2 | 3 | 3 | 3 | 174 |
| Ricky Stenhouse Jr | 4 | 4.50 | 14.3 | 12 | 1 | 2 | 2 | 2 | 3 | 26 |
| Joey Logano | 4 | 13.30 | 10.3 | 15.5 | 1 | 2 | 2 | 2 | 2 | 120 |
| Aric Almirola | 4 | 24.30 | 19.3 | 11 | 0 | 2 | 3 | 3 | 3 | 1 |
| Jamie McMurray | 4 | 23.30 | 18.3 | 15.5 | 0 | 2 | 2 | 2 | 3 | 0 |
| Kyle Busch | 4 | 14.30 | 15.3 | 15.5 | 0 | 2 | 2 | 2 | 2 | 66 |
| Kurt Busch | 4 | 11.00 | 12 | 10.8 | 0 | 1 | 3 | 3 | 3 | 3 |
| Denny Hamlin | 4 | 10.50 | 12 | 12.8 | 0 | 1 | 2 | 3 | 3 | 64 |
| Trevor Bayne | 4 | 9.80 | 14.5 | 16.8 | 0 | 1 | 2 | 2 | 3 | 27 |
| Kasey Kahne | 4 | 17.00 | 20.5 | 21.8 | 0 | 1 | 2 | 2 | 2 | 5 |
| Austin Dillon | 4 | 11.80 | 20.8 | 19.3 | 0 | 1 | 2 | 2 | 2 | 1 |
| Chase Elliott | 4 | 3.80 | 10 | 15.8 | 0 | 1 | 1 | 2 | 3 | 62 |
| Ryan Newman | 4 | 20.50 | 26.3 | 17.3 | 0 | 1 | 1 | 2 | 2 | 6 |
| David Ragan | 4 | 35.50 | 23.8 | 19.5 | 0 | 0 | 2 | 2 | 2 | 2 |
| Kyle Larson | 4 | 20.30 | 16.5 | 15 | 0 | 0 | 1 | 3 | 3 | 9 |
| Paul Menard | 4 | 12.30 | 17 | 15 | 0 | 0 | 1 | 3 | 3 | 1 |
| Ryan Blaney | 4 | 14.80 | 12.5 | 19.3 | 0 | 0 | 1 | 2 | 3 | 30 |
| Kevin Harvick | 4 | 19.80 | 14 | 16.3 | 0 | 0 | 1 | 2 | 3 | 24 |
| Clint Bowyer | 4 | 23.50 | 20.8 | 18.5 | 0 | 0 | 1 | 2 | 3 | 10 |
| AJ Allmendinger | 4 | 27.80 | 26.3 | 19.3 | 0 | 0 | 1 | 2 | 2 | 2 |
| Gray Gaulding | 2 | 38.00 | 27 | 14.5 | 0 | 0 | 1 | 1 | 2 | 0 |
| Jimmie Johnson | 4 | 15.00 | 12.8 | 19.3 | 0 | 0 | 1 | 1 | 1 | 3 |
| Ty Dillon | 2 | 26.50 | 18.5 | 12 | 0 | 0 | 0 | 2 | 2 | 3 |
| Daniel Suarez | 2 | 10.50 | 16 | 17 | 0 | 0 | 0 | 1 | 2 | 11 |
| Chris Buescher | 4 | 30.50 | 25.3 | 22.8 | 0 | 0 | 0 | 1 | 2 | 0 |
| Martin Truex Jr | 4 | 11.80 | 17 | 27.8 | 0 | 0 | 0 | 1 | 1 | 2 |
| Cole Whitt | 3 | 37.30 | 27.3 | 22.7 | 0 | 0 | 0 | 0 | 2 | 1 |
| Matt DiBenedetto | 4 | 32.00 | 27 | 28 | 0 | 0 | 0 | 0 | 1 | 12 |
| Brendan Gaughan | 2 | 33.50 | 29 | 22.5 | 0 | 0 | 0 | 0 | 1 | 6 |
| Michael McDowell | 4 | 29.50 | 19.8 | 25.3 | 0 | 0 | 0 | 0 | 1 | 0 |
| DJ Kennington | 1 | 40.00 | 32 | 33 | 0 | 0 | 0 | 0 | 0 | 0 |
| Alex Bowman | 1 | 19.00 | 14 | 36 | 0 | 0 | 0 | 0 | 0 | 0 |
| Joey Gase | 2 | 38.00 | 29 | 26.5 | 0 | 0 | 0 | 0 | 0 | 0 |
| Erik Jones | 2 | 18.50 | 23.5 | 34.5 | 0 | 0 | 0 | 0 | 0 | 0 |
| Reed Sorenson | 2 | 22.5 | 39 | 38.5 | 0 | 0 | 0 | 0 | 0 | 0 |
| Ross Chastain | 0 | 0.00 | 0 | 0 | 0 | 0 | 0 | 0 | 0 | 0 |
| William Byron | 0 | 0.00 | 0 | 0 | 0 | 0 | 0 | 0 | 0 | 0 |
| Timothy Peters | 0 | 0.00 | 0 | 0 | 0 | 0 | 0 | 0 | 0 | 0 |
| Timmy Hill | 0 | 0.00 | 0 | 0 | 0 | 0 | 0 | 0 | 0 | 0 |
| Darrell Wallace Jr | 0 | 0.00 | 0 | 0 | 0 | 0 | 0 | 0 | 0 | 0 |
| Cole Custer | 0 | 0.00 | 0 | 0 | 0 | 0 | 0 | 0 | 0 | 0 |
| Fast | Top 15 | Laps | Avg. | High | Low | Pos | Laps Led | High to | Low to | |
| Driver | Laps | Rate | Comp. | Rating | Rating | Rating | Diff | Pts./Race | Avg Rating | Avg Rating |
| Brad Keselowski | 11 | 81% | 711 | 105.4 | 125.2 | 91.5 | -7.3 | 10.88 | 19.8 | 13.9 |
| Ricky Stenhouse Jr | 14 | 56% | 742 | 87.2 | 98.8 | 72.7 | -7.5 | 1.63 | 11.6 | 14.5 |
| Joey Logano | 13 | 81% | 728 | 99.9 | 111.8 | 88.3 | -2.2 | 7.50 | 11.9 | 11.6 |
| Aric Almirola | 9 | 33% | 751 | 70.4 | 81.2 | 60.8 | 13.3 | 0.06 | 10.8 | 9.6 |
| Jamie McMurray | 10 | 50% | 596 | 74.7 | 99.4 | 37.2 | 7.8 | 0.00 | 24.7 | 37.5 |
| Kyle Busch | 12 | 63% | 742 | 89.6 | 112.2 | 55.8 | -1.2 | 4.13 | 22.6 | 33.8 |
| Kurt Busch | 16 | 74% | 742 | 90.4 | 100.3 | 79.1 | 0.2 | 0.19 | 9.9 | 11.3 |
| Denny Hamlin | 8 | 68% | 741 | 91.3 | 108.1 | 82.9 | -2.3 | 0.00 | 16.8 | 8.4 |
| Trevor Bayne | 15 | 61% | 736 | 81.2 | 91.9 | 65.5 | -7 | 1.69 | 10.7 | 15.7 |
| Kasey Kahne | 18 | 40% | 652 | 71.5 | 84 | 53.4 | -4.8 | 0.31 | 12.5 | 18.1 |
| Austin Dillon | 24 | 27% | 719 | 72.3 | 83.1 | 58.7 | -7.5 | 0.06 | 10.8 | 13.6 |
| Chase Elliott | 8 | 78% | 730 | 93.5 | 101.3 | 80 | -12 | 3.88 | 7.8 | 13.5 |
| Ryan Newman | 23 | 11% | 743 | 56.5 | 65.2 | 48.1 | 3.2 | 0.38 | 8.7 | 8.4 |
| David Ragan | 16 | 17% | 722 | 59.4 | 72.4 | 46.6 | 16 | 0.13 | 13 | 12.8 |
| Kyle Larson | 17 | 54% | 743 | 78.8 | 96.8 | 60.4 | 5.3 | 0.56 | 18 | 18.4 |
| Paul Menard | 19 | 46% | 751 | 72.8 | 88 | 53.2 | -2.7 | 0.06 | 15.2 | 19.6 |
| Ryan Blaney | 13 | 67% | 717 | 93.3 | 98.3 | 88 | -4.5 | 1.88 | 5 | 5.3 |
| Kevin Harvick | 9 | 57% | 747 | 83.2 | 94.1 | 68.8 | 3.5 | 1.50 | 10.9 | 14.4 |
| Clint Bowyer | 29 | 40% | 726 | 70.6 | 79.4 | 67 | 5 | 0.63 | 8.8 | 3.6 |
| AJ Allmendinger | 20 | 15% | 720 | 55.5 | 58.5 | 53.5 | 8.5 | 0.13 | 3 | 2 |
| Gray Gaulding | 13 | 9% | 379 | 52.8 | 61.2 | 44.4 | 23.5 | 0.00 | 8.4 | 8.4 |
| Jimmie Johnson | 8 | 69% | 736 | 83.1 | 99.8 | 69.6 | -4.3 | 0.19 | 16.7 | 13.5 |
| Ty Dillon | 13 | 34% | 379 | 72.1 | 74.8 | 69.3 | 14.5 | 0.38 | 2.7 | 2.8 |
| Daniel Suarez | 7 | 48% | 375 | 68.2 | 78 | 58.4 | -6.5 | 1.38 | 9.8 | 9.8 |
| Chris Buescher | 7 | 17% | 660 | 54.1 | 66.3 | 45.2 | 7.7 | 0.00 | 12.2 | 8.9 |
| Martin Truex Jr | 7 | 61% | 568 | 80.1 | 94.3 | 49.5 | -16 | 6.00 | 14.2 | 30.6 |
| Cole Whitt | 8 | 6% | 534 | 48.5 | 53.8 | 40.2 | 14.6 | 0.08 | 5.3 | 8.3 |
| Matt DiBenedetto | 10 | 8% | 652 | 49.8 | 61.7 | 38.9 | 4 | 0.75 | 11.9 | 10.9 |
| Brendan Gaughan | 10 | 12% | 360 | 52.5 | 69.3 | 35.6 | 11 | 0.75 | 16.8 | 16.9 |
| Michael McDowell | 15 | 31% | 719 | 69.3 | 74.3 | 59 | 4.2 | 0.00 | 5 | 10.3 |
| DJ Kennington | 5 | 2% | 164 | 39.9 | 39.9 | 39.9 | 7 | 0.00 | 0 | 0 |
| Alex Bowman | 4 | 59% | 191 | 71.2 | 71.2 | 71.2 | -17 | 0.00 | 0 | 0 |
| Joey Gase | 2 | 5% | 355 | 44.2 | 47.5 | 40.8 | 11.5 | 0.00 | 3.3 | 3.4 |
| Erik Jones | 2 | 30% | 194 | 56.3 | 77.8 | 34.7 | -16 | 0.00 | 21.5 | 21.6 |
| Reed Sorenson | 0 | 0% | 251 | 24.4 | 25.5 | 23.2 | -16 | 0.00 | 1.1 | 1.2 |
| Ross Chastain | 0 | 0% | 0 | 0 | 0 | 0 | 0 | 0 | 0 | |
| William Byron | 0 | 0% | 0 | 0 | 0 | 0 | 0 | 0 | 0 | |
| Timothy Peters | 0 | 0% | 0 | 0 | 0 | 0 | 0 | 0 | 0 | |
| Timmy Hill | 0 | 0% | 0 | 0 | 0 | 0 | 0 | 0 | 0 | |
| Darrell Wallace Jr | 0 | 0% | 0 | 0 | 0 | 0 | 0 | 0 | 0 | |
| Cole Custer | 0 | 0% | 0 | 0 | 0 | 0 | 0 | 0 | 0 |
*Laps Comp. are out of 759 total in the last four races
Top-15 Drivers over Last 10 Races at Talladega
| Avg. | Avg. | Avg. | Top | Top | Top | Top | Laps | |||
| Driver | Races | Start | Run Pos. | Finish | Wins | 5s | 10s | 15s | 20s | Led |
| Brad Keselowski | 10 | 8.6 | 15.5 | 15.6 | 3 | 4 | 5 | 6 | 6 | 188 |
| Joey Logano | 10 | 16.2 | 14.1 | 19 | 2 | 3 | 3 | 4 | 5 | 172 |
| Ricky Stenhouse Jr | 9 | 14.6 | 16.3 | 12.1 | 1 | 3 | 5 | 6 | 7 | 37 |
| Jamie McMurray | 10 | 24.4 | 19.6 | 20 | 1 | 3 | 3 | 4 | 5 | 21 |
| Denny Hamlin | 10 | 16.1 | 17.1 | 18.8 | 1 | 2 | 4 | 5 | 6 | 87 |
| David Ragan | 10 | 26.3 | 23.8 | 21.8 | 1 | 1 | 4 | 4 | 4 | 11 |
| Kyle Busch | 9 | 19.2 | 19.7 | 18.6 | 0 | 3 | 3 | 5 | 5 | 87 |
| Paul Menard | 10 | 14.1 | 15.8 | 14.1 | 0 | 2 | 5 | 7 | 7 | 14 |
| Clint Bowyer | 10 | 23.3 | 21.9 | 14.6 | 0 | 2 | 5 | 6 | 8 | 14 |
| Ryan Newman | 10 | 15.7 | 26 | 15.2 | 0 | 2 | 4 | 6 | 7 | 20 |
| Aric Almirola | 10 | 20.1 | 20.3 | 15.9 | 0 | 2 | 4 | 6 | 7 | 10 |
| Jimmie Johnson | 10 | 10.9 | 8.9 | 16.2 | 0 | 2 | 3 | 4 | 5 | 236 |
| Kurt Busch | 10 | 16.7 | 12.3 | 15.3 | 0 | 1 | 5 | 6 | 7 | 10 |
| Martin Truex Jr | 10 | 18.7 | 15.6 | 18.2 | 0 | 1 | 4 | 5 | 6 | 8 |
| Kasey Kahne | 10 | 16 | 21.4 | 23.8 | 0 | 1 | 3 | 4 | 5 | 39 |
| Fast | Top 15 | Laps | Avg. | High | Low | Pos. | Laps Led | Rating | |
| Driver | Laps | Rate | Comp. | Rating | Rating | Rating | Diff. | Pts/Race | Range |
| Brad Keselowski | 30 | 62% | 1828 | 91.8 | 125.2 | 32.6 | -7 | 4.70 | 92.6 |
| Joey Logano | 39 | 66% | 1809 | 90.7 | 111.8 | 44.3 | -2.8 | 4.30 | 67.5 |
| Ricky Stenhouse Jr | 41 | 50% | 1694 | 81.4 | 105.5 | 46.9 | 2.5 | 1.03 | 58.6 |
| Jamie McMurray | 32 | 49% | 1721 | 74.9 | 115.2 | 32.4 | 4.4 | 0.53 | 82.8 |
| Denny Hamlin | 27 | 54% | 1788 | 83.5 | 123.2 | 34.9 | -2.7 | 2.18 | 88.3 |
| David Ragan | 50 | 20% | 375 | 63.1 | 78.2 | 46.6 | 4.5 | 0.28 | 31.6 |
| Kyle Busch | 30 | 51% | 1597 | 80.6 | 112.2 | 31.1 | 0.6 | 2.42 | 81.1 |
| Paul Menard | 55 | 54% | 1887 | 81 | 98.9 | 53.2 | 0 | 0.35 | 45.7 |
| Clint Bowyer | 71 | 36% | 1872 | 74.1 | 88.5 | 61.7 | 8.7 | 0.35 | 26.8 |
| Ryan Newman | 53 | 14% | 1879 | 59.4 | 76.8 | 45.8 | 0.5 | 0.00 | 31 |
| Aric Almirola | 28 | 35% | 1869 | 73 | 103.3 | 56.3 | 4.2 | 0.25 | 47 |
| Jimmie Johnson | 20 | 81% | 1882 | 100.7 | 119.2 | 69.6 | -5.3 | 5.90 | 49.6 |
| Kurt Busch | 29 | 72% | 1864 | 92.1 | 110.6 | 79.1 | 1.4 | 0.25 | 31.5 |
| Martin Truex Jr | 18 | 64% | 1714 | 85 | 107.4 | 49.5 | 0.5 | 0.20 | 57.9 |
| Kasey Kahne | 34 | 43% | 1616 | 75.8 | 104.4 | 32.5 | -7.8 | 0.98 | 71.9 |
*Laps Comp. are out of 1,905 total run in the last 10 races at Talladega
Top-15 Drivers at Restrictor Plate Tracks (since 2013)
| Avg. | Avg. | Avg. | Top | Top | Top | Top | Laps | |||
| Driver | Races | Start | Run Pos. | Finish | Wins | 5s | 10s | 15s | 20s | Led |
| Brad Keselowski | 20 | 15.1 | 15.5 | 19 | 4 | 6 | 7 | 8 | 10 | 354 |
| Joey Logano | 20 | 16.2 | 14.8 | 16.8 | 3 | 6 | 8 | 10 | 12 | 230 |
| Denny Hamlin | 20 | 17.4 | 14.6 | 15.1 | 2 | 7 | 10 | 11 | 14 | 277 |
| Ricky Stenhouse Jr | 19 | 16.5 | 18.1 | 16 | 2 | 5 | 8 | 10 | 12 | 65 |
| Jimmie Johnson | 20 | 13.7 | 12.6 | 17.6 | 1 | 6 | 7 | 9 | 11 | 448 |
| Kurt Busch | 19 | 16.7 | 12.2 | 14.5 | 1 | 4 | 10 | 11 | 12 | 78 |
| Aric Almirola | 19 | 22.4 | 19.8 | 17.3 | 1 | 4 | 6 | 12 | 13 | 32 |
| Austin Dillon | 18 | 14.7 | 19.1 | 15.9 | 1 | 3 | 8 | 12 | 13 | 19 |
| Jamie McMurray | 20 | 20.9 | 17.7 | 20.1 | 1 | 3 | 4 | 8 | 11 | 55 |
| David Ragan | 20 | 26 | 23.8 | 21.6 | 1 | 1 | 5 | 6 | 8 | 25 |
| Kyle Busch | 18 | 17.7 | 18.8 | 18.4 | 0 | 5 | 5 | 8 | 11 | 188 |
| Clint Bowyer | 20 | 19.6 | 21.9 | 15.5 | 0 | 4 | 11 | 13 | 15 | 21 |
| Kevin Harvick | 20 | 19.1 | 18.1 | 17.3 | 0 | 4 | 8 | 12 | 13 | 108 |
| Paul Menard | 20 | 17 | 17.1 | 17.1 | 0 | 4 | 8 | 10 | 13 | 44 |
| Ryan Newman | 20 | 18.3 | 25.3 | 15.9 | 0 | 3 | 8 | 11 | 13 | 22 |
| Fast | Top 15 | Laps | Avg. | High | Low | Pos | Laps Led | Rating | |
| Driver | Laps | Rate | Comp. | Rating | Rating | Rating | Diff. | Pts./Race | Range |
| Brad Keselowski | 57 | 60% | 3338 | 89.1 | 132.4 | 32.6 | -3.9 | 4.43 | 99.8 |
| Joey Logano | 89 | 64% | 3429 | 90.8 | 125.3 | 44.3 | -0.6 | 2.88 | 81 |
| Denny Hamlin | 54 | 63% | 3542 | 89.4 | 139.1 | 34.9 | 2.3 | 3.46 | 104.2 |
| Ricky Stenhouse Jr | 81 | 43% | 3310 | 77.6 | 105.5 | 34.1 | 0.5 | 0.86 | 71.4 |
| Jimmie Johnson | 45 | 70% | 3265 | 94.2 | 140.7 | 48.3 | -3.9 | 5.60 | 92.4 |
| Kurt Busch | 62 | 72% | 3409 | 93 | 120.8 | 75.9 | 2.2 | 1.03 | 44.9 |
| Aric Almirola | 60 | 37% | 3361 | 73.7 | 111.4 | 56.3 | 5.1 | 0.42 | 55.1 |
| Austin Dillon | 85 | 42% | 3154 | 74.8 | 90.7 | 43.1 | -1.2 | 0.00 | 47.6 |
| Jamie McMurray | 62 | 53% | 3343 | 78.8 | 115.2 | 32.4 | 0.8 | 0.69 | 82.8 |
| David Ragan | 79 | 23% | 3410 | 63 | 96.2 | 32.2 | 4.4 | 0.31 | 64 |
| Kyle Busch | 61 | 51% | 3043 | 80.9 | 117.2 | 31.1 | -0.7 | 2.61 | 86.1 |
| Clint Bowyer | 108 | 35% | 3493 | 72 | 104 | 41 | 4.1 | 0.26 | 63 |
| Kevin Harvick | 56 | 51% | 3215 | 83.3 | 116.3 | 32 | 1.8 | 1.35 | 84.3 |
| Paul Menard | 90 | 52% | 3429 | 79.2 | 98.9 | 46.3 | -0.1 | 0.55 | 52.6 |
| Ryan Newman | 94 | 16% | 3613 | 60 | 90.9 | 43.2 | 2.4 | 0.28 | 47.7 |
*Laps Comp. are out of 3,673 laps run total at the last 20 restrictor plate races
Momentum (last five races in 2018)
This will update each week with the most recent race making the fifth race. Therefore it will be a rolling total of just how hot a driver has been over that stretch.
| Avg. | Avg. | Avg. | Top | Top | Top | Top | Pos | Avg. | |||
| Driver | Races | Start | Run Pos. | Finish | Wins | 5s | 10s | 15s | 20s | Diff. | Rating |
| Kyle Busch | 5 | 9 | 3.8 | 1.6 | 3 | 5 | 5 | 5 | 5 | 7.4 | 127.3 |
| Martin Truex Jr | 5 | 7 | 14.6 | 17.2 | 1 | 2 | 2 | 3 | 3 | -10.2 | 92.9 |
| Clint Bowyer | 5 | 13.6 | 8 | 7.6 | 1 | 1 | 4 | 5 | 5 | 6 | 103.4 |
| Kevin Harvick | 5 | 13.8 | 12.6 | 10.8 | 0 | 3 | 4 | 4 | 4 | 3 | 99.1 |
| Joey Logano | 5 | 5.8 | 6 | 6 | 0 | 2 | 5 | 5 | 5 | -0.2 | 108 |
| Kyle Larson | 5 | 6.2 | 12.4 | 12.6 | 0 | 2 | 3 | 3 | 4 | -6.4 | 94.6 |
| Ryan Blaney | 5 | 7 | 9.8 | 14.6 | 0 | 2 | 3 | 3 | 3 | -7.6 | 94.6 |
| Jimmie Johnson | 5 | 18.8 | 15 | 13.6 | 0 | 1 | 3 | 4 | 4 | 5.2 | 86.3 |
| Brad Keselowski | 5 | 11.4 | 9.4 | 15.6 | 0 | 1 | 3 | 3 | 3 | -4.2 | 97.6 |
| Denny Hamlin | 5 | 13 | 11.4 | 13.8 | 0 | 1 | 2 | 4 | 4 | -0.8 | 97.8 |
| Erik Jones | 5 | 11.6 | 13.6 | 13.4 | 0 | 1 | 2 | 3 | 4 | -1.8 | 84.6 |
| Chase Elliott | 5 | 18 | 16.2 | 13.4 | 0 | 1 | 2 | 3 | 4 | 4.6 | 74.4 |
| Alex Bowman | 5 | 15.8 | 19 | 14.2 | 0 | 1 | 2 | 3 | 4 | 1.6 | 72.8 |
| Jamie McMurray | 5 | 20.8 | 16.2 | 16.8 | 0 | 1 | 1 | 1 | 4 | 4 | 72.1 |
| Ricky Stenhouse Jr | 5 | 15 | 19.2 | 21.4 | 0 | 1 | 1 | 1 | 2 | -6.4 | 65.3 |
Points Changes at Talladega
The 2017 race points are the points scored in this specific race a year ago. The season DK points average is what the driver is averaging for the races thus far in 2018. It's a good way to see how much over or right on the average that driver did at this track a year prior. Clearly, each race is different, but it's a way to gauge who fits what lineup format better. The drivers closer to their average might be better for cash whereas those to the more extreme ends of the table could fit GPPs better with a boom-or-bust type showing. The Avg. +/- number means that the whole field in general has either done better or worse than their season averages by that number.
| 17 Race | Season | DK Pts +/- | |
| Driver | Total | Avg DK Pts. | Season AVG |
| Jamie McMurray | 64.50 | 25.2 | 39.3 |
| David Ragan | 56.00 | 22.25 | 33.8 |
| Kasey Kahne | 55.00 | 22.07 | 32.9 |
| Ty Dillon | 53.25 | 22.45 | 30.8 |
| Jimmie Johnson | 59.75 | 29 | 30.8 |
| Ricky Stenhouse Jr | 52.00 | 23.48 | 28.5 |
| Gray Gaulding | 43.50 | 15.22 | 28.3 |
| Joey Gase | 41.50 | 17 | 24.5 |
| Chris Buescher | 49.00 | 25.83 | 23.2 |
| Cole Whitt | 50.50 | 27.83 | 22.7 |
| Aric Almirola | 58.00 | 38.48 | 19.5 |
| Kurt Busch | 51.00 | 35.68 | 15.3 |
| Matt DiBenedetto | 35.50 | 23.7 | 11.8 |
| Paul Menard | 36.75 | 25.28 | 11.5 |
| Brad Keselowski | 43.25 | 40.61 | 2.6 |
| Kyle Larson | 44.50 | 42.02 | 2.5 |
| Brendan Gaughan | 27.00 | 25.75 | 1.3 |
| Denny Hamlin | 44.25 | 44.89 | -0.6 |
| Daniel Suarez | 15.50 | 24.82 | -9.3 |
| Kyle Busch | 60.50 | 72.14 | -11.6 |
| Reed Sorenson | -3.00 | 10.12 | -13.1 |
| Clint Bowyer | 40.50 | 54.3 | -13.8 |
| Ryan Newman | 16.00 | 30.09 | -14.1 |
| AJ Allmendinger | 13.50 | 29.08 | -15.6 |
| Michael McDowell | 1.50 | 22.75 | -21.3 |
| Erik Jones | -7.00 | 31.61 | -38.6 |
| Austin Dillon | -6.00 | 32.64 | -38.6 |
| Chase Elliott | -7.50 | 33.07 | -40.6 |
| Trevor Bayne | -22.25 | 21.6 | -43.9 |
| Joey Logano | -4.50 | 45 | -49.5 |
| Martin Truex Jr | -11.50 | 43.18 | -54.7 |
| Kevin Harvick | 9.75 | 65.75 | -56.0 |
| Ryan Blaney | -15.50 | 48 | -63.5 |
| AVG +/- | 25.6 |
Top-10 and Bottom 10 Value Drivers
DraftKings
| Rank | Driver | Value | Rank | Driver | Value |
|---|---|---|---|---|---|
| 1 | Kyle Busch | 7.51 | 40 | Reed Sorenson | 2.25 |
| 2 | Kevin Harvick | 6.71 | 39 | Ricky Stenhouse Jr | 2.58 |
| 3 | Clint Bowyer | 6.46 | 38 | Timmy Hill | 2.65 |
| 4 | Cole Whitt | 5.80 | 37 | Gray Gaulding | 2.98 |
| 5 | Ryan Blaney | 5.33 | 36 | Trevor Bayne | 3.18 |
| 6 | Brendan Gaughan | 5.26 | 35 | Jamie McMurray | 3.23 |
| 7 | D.J. Kennington | 5.23 | 34 | Chase Elliott | 3.27 |
| 8 | AJ Allmendinger | 4.93 | 33 | Jimmie Johnson | 3.30 |
| 9 | Aric Almirola | 4.75 | 32 | Ty Dillon | 3.35 |
| 10 | Matt DiBenedetto | 4.56 | 31 | Kasey Kahne | 3.45 |
FanDuel
| Rank | Driver | Value | Rank | Driver | Value |
| 1 | D.J. Kennington | 10.78 | 40 | Timothy Peters | 0.00 |
| 2 | Matt DiBenedetto | 10.38 | 39 | Ricky Stenhouse Jr. | 4.39 |
| 3 | Cole Whitt | 10.31 | 38 | Jimmie Johnson | 4.40 |
| 4 | Cole Custer | 8.98 | 37 | Brad Keselowski | 4.61 |
| 5 | Ross Chastain | 8.64 | 36 | Jamie McMurray | 4.88 |
| 6 | AJ Allmendinger | 8.38 | 35 | Chase Elliott | 5.04 |
| 7 | Darrell Wallace Jr. | 8.38 | 34 | Kasey Kahne | 5.13 |
| 8 | Chris Buescher | 8.25 | 33 | Martin Truex Jr. | 5.24 |
| 9 | Ty Dillon | 8.13 | 32 | Kurt Busch | 5.24 |
| 10 | Gray Gaulding | 7.94 | 31 | Denny Hamlin | 5.31 |
Drivers to Watch This Week:
Brad Keselowski: Keselowski is known as one of, if not, the best restrictor plate races in the MENCS today. His stats here bare that out. He has two wins, three top-10s, and 174 laps led in the last four races here, all best or tied for the best in the field. In the last 10 races here, those totals go up to three wins, four top-fives, five top-10s, six top-15s, and 188 laps led. Keselowski’s average driver rating in the last four, is the only one in the field over 100 (105.4). All of this point to him being a solid cash option come race day on Sunday.
Ricky Stenhouse Jr.: Stenhouse won this race a year ago, for his first career race win, and has been solid on these tracks in general. He has two top-fives, two top-10s, and three top-20s total in the last four races here with 26 laps led. His average finish of P12 is good for third in the field in that span, despite tying with Keselowski for the second-best average starting spot of 4.5. The driver of the 17-car has completed all but 17 laps here in the last four races (742 out of 759 run), which puts him tied for fourth in the field in that category. He’s had his ups and downs the last few races but should run well this week.
Joey Logano: The Penske team in general typically has good restrictor plate cars, so it’s not a surprise that Logano has also run well here in past races. A win, two top-fives, two top-10s, and 120 laps led make him one of the best drivers in the field this week, and the last of the three with a win in the last four. The laps led and average driver rating (99.9) put him second in both categories to his teammate Brad Keselowski. Over the last 10 races here, Logano has two wins, three top-fives, four top-15s, and 172 laps led. The 22-car is priced like an elite choice this week, $400 less than Brad on DK costing $10,300 and $100 less on FD costing $12,000. He could work for both with his teammate.
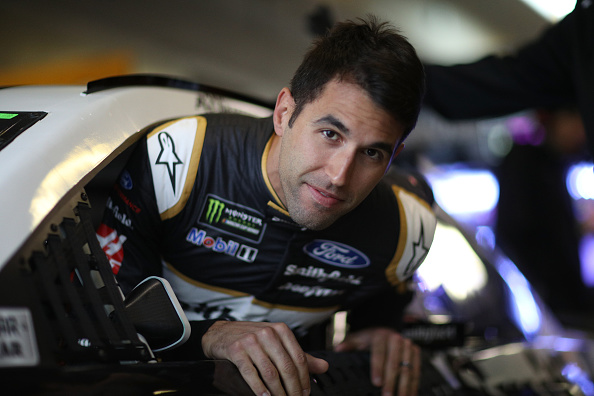 Aric Almirola: Almirola’s move to SHR has been good for him, and now he comes to a track that has seen him do very well of late. In the last four races at ‘Dega he has two top-fives and three top-10s to his credit and his P11 average finish is just a tick behind teammate Kurt Busch’s 10.8 mark for second in the field. Despite those good finishes, and a high PD of +13.3, he has run in the top 15 just 33% of the time and has a middling 70.4 driver rating. He is tied with Paul Menardfor most laps completed since the start of 2016 here with 751 out of 759. In the $8k range on both sites, he should be on the top of the mid-tier list to fill-in the lineups.
Jamie McMurray: McMurray is one of only six drivers with two top-fives in the last four races, the four listed above plus Kyle Buschare the other ones. The problem for Jamie Mac is that there really isn’t much else to his recent resume here. However over the last 10 he does have a win, three top-fives, and four top-15s with 21 laps led. Typically in the shadow of his teammate Kyle Larson, McMurray performs better here than the 42-car and should once again this week. The only risk that comes with the 1-car is the fact he’s completed just 596 laps of 759 in the last four races. The only other driver in the last four races to be that low is Martin Truex Jr. at 568. On the upside though, he has been the highest-scoring driver in DraftKings on average over the last three spring races here, at better than 62 points a race.