


New Hampshire Motor Speedway is the host venue this weekend. Known as the Magic Mile, it’s a shorter, flatter track in the realm of Phoenix, Richmond, Gateway, and even a tad of Martinsville. Just how short is it, it’s 1.058 miles in length with banking no more than seven degrees. If you want more track stats and layout info you can check out the Track Breakdown for this week’s Ambetter 301. Let’s look into Practice and Qualifying data along with some DFS strategy following qualifying before looking at the top plays for New Hampshire.
Practice To Qualifying
Below is a table showing the not only the qualifying spots for each driver but also the practice speeds. Comb. Prac. Is the single lap speed, each of the other columns show that lap average speed and where it ranks. It’s designed to show you how each driver stacks up against where they qualified.
| Driver | DK$ | FD $ | Prac to Qual | Qual | Comb. Prac | 5-Lap | 10-lap | 15-Lap |
| Kyle Busch | $11,000 | $12,500 | 15 | 17 | 2 | 2 | 1 | 1 |
| Joey Logano | $10,800 | $13,500 | -12 | 12 | 24 | 22 | 16 | 11 |
| Denny Hamlin | $10,600 | $12,000 | -7 | 14 | 21 | 28 | ||
| Martin Truex Jr | $10,400 | $11,000 | -4 | 1 | 5 | 11 | 8 | 7 |
| Chase Elliott | $10,300 | $13,000 | -4 | 2 | 6 | 5 | 10 | |
| Ryan Blaney | $10,000 | $14,000 | -12 | 11 | 23 | 21 | 13 | 12 |
| Ross Chastain | $9,800 | $11,500 | 6 | 18 | 12 | 12 | 11 | |
| Kyle Larson | $9,600 | $10,500 | 4 | 8 | 4 | 4 | 4 | 5 |
| William Byron | $9,400 | $10,000 | 5 | 6 | 1 | 1 | 3 | |
| Christopher Bell | $9,100 | $9,500 | -15 | 5 | 20 | 18 | ||
| Kevin Harvick | $8,800 | $8,200 | 1 | 10 | 9 | 10 | 7 | 2 |
| Tyler Reddick | $8,600 | $8,500 | -9 | 13 | 22 | 25 | 15 | 9 |
| Chase Briscoe | $8,400 | $9,800 | 26 | 29 | 3 | 3 | 2 | |
| Kurt Busch | $8,200 | $8,000 | -22 | 3 | 25 | 23 | 18 | 10 |
| Aric Almirola | $8,100 | $7,800 | -3 | 7 | 10 | 9 | 5 | 3 |
| Daniel Suarez | $7,900 | $7,500 | -7 | 19 | 26 | 20 | 14 | |
| Alex Bowman | $7,800 | $9,000 | 10 | 27 | 17 | 19 | 17 | |
| Austin Cindric | $7,600 | $6,500 | 0 | 28 | 28 | 27 | 19 | 8 |
| Bubba Wallace | $7,400 | $5,500 | -7 | 4 | 11 | 7 | 9 | 4 |
| Erik Jones | $7,300 | $7,000 | 8 | 22 | 14 | 6 | ||
| AJ Allmendinger | $7,100 | $4,000 | 5 | 20 | 15 | 24 | ||
| Brad Keselowski | $6,900 | $6,000 | 1 | 9 | 8 | 14 | 12 | |
| Ricky Stenhouse Jr | $6,700 | $5,000 | -8 | 24 | 32 | 31 | 24 | |
| Michael McDowell | $6,500 | $6,800 | -15 | 15 | 30 | 29 | ||
| Austin Dillon | $6,300 | $5,800 | 1 | 30 | 29 | |||
| Chris Buescher | $6,100 | $7,200 | 9 | 16 | 7 | 8 | 22 | |
| Justin Haley | $5,900 | $4,500 | 9 | 25 | 16 | 15 | ||
| Cole Custer | $5,800 | $4,500 | 4 | 23 | 19 | 17 | ||
| Corey Lajoie | $5,600 | $3,000 | -6 | 21 | 27 | 26 | 20 | |
| Ty Dillon | $5,400 | $4,000 | 17 | 35 | 18 | 16 | 21 | 13 |
| Harrison Burton | $5,200 | $3,500 | 18 | 31 | 13 | 13 | 6 | 6 |
| Todd Gilliland | $5,100 | $2,500 | -5 | 26 | 31 | 30 | 23 | |
| Cody Ware | $5,000 | $2,000 | 0 | 36 | 36 | |||
| BJ McLeod | $4,800 | $2,000 | -3 | 32 | 35 | 34 | ||
| Josh Bilicki | $4,600 | $2,000 | 1 | 34 | 33 | 32 | 25 | |
| JJ Yeley | $4,500 | $2,000 | -1 | 33 | 34 | 33 |
NASCAR DFS Strategy
As was talked about on the Podcast this week with Edward Raus and I, the pricing is a bit interesting. That was even before we saw cars on track. It got more interesting on Saturday. If you take a look at some of the stats shown in the Track Breakdown we can deduce how the strategy has worked here in the past. The first thing that jumps out is that track position has been king here. An average of 3.4 drivers a race have finished in the top-10 after starting outside the top-12. That indicates passing is tough, especially the closer to the front you get. That being said though, the drivers that are starting further back in the field have been able to move up some. An average of 10.4 drivers a race have posted six or more spots of PD in the last five races while half that money have moved up double-digit spots a race. With 300 laps in the race, Laps Led and Fastest Laps can be differentiators in builds. However, it’s hard to see there being one dominator in a race given that there have only been three total drivers to top 100 laps led in the last five races combined. Studying the practice numbers will help, though it is important to note (and perhaps rewatch USA’s coverage of it) which drivers were in Group A and which were in Group B. As the track rubbered up, the pace slowed down and that might be an indicator of what we see in the race as well.
Average Points By Starting Spots
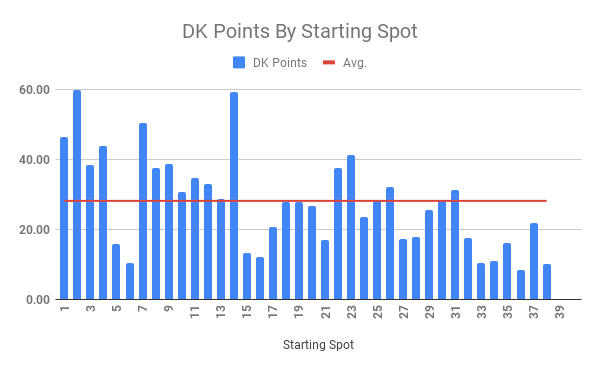
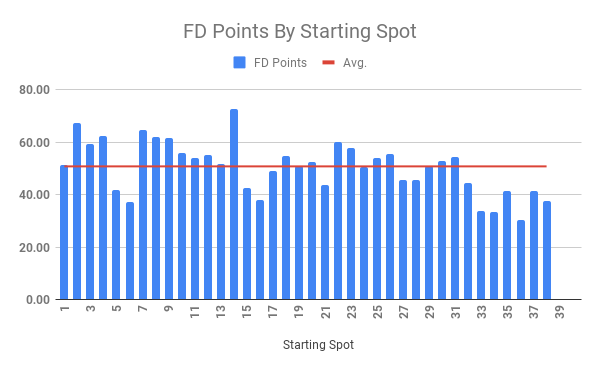
The following charts show the average DFS points scored by starting spot over the last five races at New Hampshire regardless of the driver in each starting spot. These are meant to illustrate strategy and not be a hard-and-fast rule for setting lineups.
Stacks
| {{stack.team.name}} | {{player.name}} |
 DraftKings | {{player.fantasy.price.value[8]}}- |
 Fanduel | {{player.fantasy.price.value[6]}}- |