
2019 MLB Draft Guide: Rays Revolutionize with the Opener

Published: Jan 29, 2019
Necessity can be the mother of all invention. With an ERA ranking 22nd in the majors and ninth in the American League, Tampa Bay needed a spark. Especially given injuries to Jake Faria and Nathan Eovaldi . In an effort to cobble together innings, the Rays introduced the “Opener” on May 19th. From this date forward, Tampa Bay ranked third in the majors in ERA and second in the American League.
Before delving into the ramifications for fantasy, it’s worth noting the average start last year dropped to just over 5 and one-third innings. In 2014, there were 89 qualified starting pitchers. Last year, only 58 pitchers reached the required innings as a qualified starter. With innings logged by starting pitchers in decline, along with analytics suggesting limiting high leverage plate appearances versus a pitcher, will the the opener strategy stick?
Tampa Bay used the opener strategy 55 times, generally exposing the reliever as a starter to face three-to-nine batters. As a franchise, the Rays finished the year with an American League best 3.61 ERA in the first innings. They went 46 - 38 with a traditional starting pitcher and 44 - 34 with the openers. Starters on the Rays worked three innings or fewer in 71 games.
 But, before dismissing bullpenning, some facts:
- Tampa Bay relievers made 62 appearances of at least 50 pitches, and 29 outings with at least 70 pitches, both the most since 1908.
- Rays relievers factored in 91 decisions, most since 1908.
- As a group, they logged 150 appearances with at least two innings, most since the Braves in 1985 (158).
- Rays relievers made 74 appearances with at least three innings, the most since the Angels in 1987 (73).
- There were 46 instances of a Tampa Bay reliever working at least four innings, again the most since 1908.
- Last, Rays relieves tallied 31 outings of at least five innings, the most since the Athletics since 1917 (34).
While traditional rotisserie leagues still use wins, saves, strikeouts and ratio statistics within its scoring system, the opener does not make too much of an overall impact. However, in leagues which count quality starts, if more teams imitate the Rays, will it create scarcity?
Given the average starting pitcher worked in just over five innings per game, quality starts could be in decline as bullpens get deeper. It’s even more prevalent in the playoffs where teams pull starting pitchers, often in the third or fourth inning. With the knowledge of the Rays staff owning the best first inning ERA in the American League, would it be better to own a pitcher working after the opener? Especially if he’s in during the innings where the game’s decision will be decided?
For example, Ryan Yarbrough won 16 games last year. Only 11 pitchers won more games. His win total matched Justin Verlander and David Price while topping the National League Cy Young Award winner, Jacob deGrom by six. But entering the game after the opener faced a team for almost one time through the batting order, Yarbrough did well taking over for them. As a traditional starter last season, Yarbrough only pitched 28.2 innings with a 4.71 ERA, 11.4 strikeouts minus walks percentage and 1.33 WHIP. When pitching as a reliever, Yarbrough worked 118.2 innings with a 3.72 ERA, 12.7 strikeouts minus walks percentage and 1.28 WHIP.
It’s apparent Yarbrough’s not a dominant pitcher, but he’s proved to be more effective entering the game in the second or third inning, then bridging the gap to the late inning high leverage relievers.
Ryne Stanek made 29 starts for the Rays last year, finishing second on the team. Of course, he worked two innings or fewer in all of these outings, but it sort of messes with league records for starters. From June seventh to July 10th, Stanek recorded nine straight starts without giving up a run to set a major league record. He only logged 13.2 innings in them. Also, according to STATS LLC, his 10 starts without giving up a run also set a record prior to the All-Star break.
Although these numbers need to be taken with a grain of salt, Stanek’s splits as a starter versus a reliever reveal some interesting tidbits:
- Stanek as an opener: 40 innings, 3.38 ERA, 22.2 K-BB%, 1.13 WHIP
- Stanek as an RP: 26.1 innings, 2.39 ERA, 17.8 K-BB%, 1.03 WHIP
As a starter, he owned a better strikeout rate and strikeouts minus walks percentage, but as a reliever, better ratio statistics.
Talented young reliever, Diego Castillo thrived as an opener, but still pitched well in relief. Here’s his splits from last year:
- Castillo as the opener: 17 innings, 2.65 ERA, 29.2 K-BB%, 0.88 WHIP
- Castillo as an RP: 39.2 innings, 3.40 ERA, 17.8 K-BB%, 0.98 WHIP
It’s not apparent if Castillo’s dominance as an opener related to knowing he could air it out at the start of game, or if he knew the batters he’d face and be prepared, but his 32.3 strikeout percentage as a starter jumps off the page.
Given the relative lack of data surrounding the opener strategy, Tampa Bay made the most of depleted staff due to injuries and then trades. As they continue to turn over the staff, it would appear Tyler Glasnow would benefit like Yarbrough working fewer and more controlled innings over his appearances. Later in the season, the Rays will be adding Brent Honeywell and Jose De León to its staff. Plus, with Charlie Morton in the rotation, will he start games or also benefit from the opener strategy?
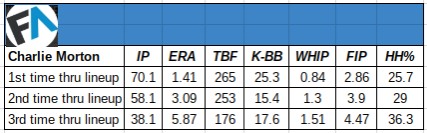
Since Morton struggled his third time through the lineup last year, perhaps an opener would keep him more involved in a decision by deploying the opener as opposed to him being used as a traditional starter.
Although most of the league did not imitate this theory immediately, Oakland did deploy the opener strategy in the second half after being ravaged by injuries to its starting pitching. Liam Hendriks made nine starts after his recall in September. Fangraphs only credits him with 8.2 innings as a starter, but in these outings, he recorded a 2.08 ERA with seven strikeouts against three walks, a 1.04 WHIP and 45.8 ground ball percentage. It’s curious to see if he can carry over the increase in ground ball rate which reflects his surge in Triple-A prior to his promotion.
Oakland also finished third in ERA during the second half. Winning 97 games will be tough to repeat, especially given their 31-13 record in one run games. Having a strong bullpen and career season by Blake Treinen fueled the A’s playoff push.
Time will tell how the opener strategy will evolve and if more teams than the Athletics will imitate it. What we do know, starting pitchers threw fewer innings on average last year. Giving them a bridge through the lineup could provide better chances for success. Tampa Bay turned its team ERA around with the strategy and will look to build on it going forward. If more teams copy the blueprint, fantasy players in quality starts leagues will need to adjust. For now, it’s still in the initial phase of development, but it’s never too early to learn from it.
According to statistics from The Ringer, in 2018, the average starting pitcher faced 23 hitters a game (not including the Rays starters). This equates to two and a half times through the batting order. Deploying an opener limits the amount of time a starter faces the heart of the batting order. It closes the gap between maximizing innings and allows teams to determine which hitters they expose their pitcher working after the opener face.
Reports suggest the Dodgers farm system started using the opener strategy in the minors, perhaps in an effort to groom pitchers for more diverse roles in the future. Minnesota also could join fray. An article from 2009 by Dave Fleming on Bill James Online speculated the future of pitching could become a 3-3-3 approach. Three pitchers working three innings each to work games.
With so many issues facing fantasy owners, targeting aces earlier in drafts could continue. Fewer innings by pitchers could translate into different strategies going forward. For now, the opener theory remains in the evolutionary phase, but, it’s worth noting. Facts, starting pitchers logged fewer innings last year. Teams will be looking to maximize performance. Plus, at a time when owners try to suppress salary, less innings by starting pitchers would translate into less money. There’s so many moving pieces here, it will be very intriguing to see how teams handle the opener in response to the recent trends.
It could be a fluky method to bridge the gap for innings and control match-ups. Or it could be here to stay in the future in its present form or as a hybrid of the 3-3-3 theorem.
-----------------------------------------------------------------------------------------------------------------
Statistical Credits:
Fangraphs.com, Baseball-Reference.com, Game notes on MLB.com, https://www.billjamesonline.com/article1004/