
Well it’s finally here…the Championship race is upon us this weekend. One race to decide everything the other 35 races have set us up for. All that stands between one of four drivers and raising the Monster Energy NASCAR Cup Series trophy is 267 laps at perhaps the most symmetrical track on the schedule.
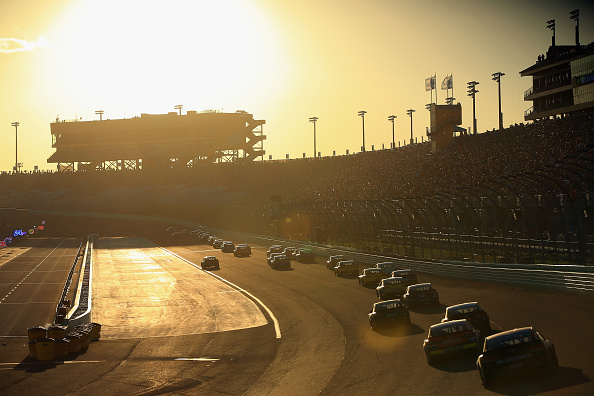
Homestead-Miami Speedway is a true oval track with two full straightaways and two symmetrical sets of corners at either end. The banking is three degrees in the straights and 18-20 degrees progressively in the corners. The 1.5-mile length makes it a track that fits in with the most common length of NASCAR tracks in general despite it having a unique layout amongst those tracks. This is the only time in a season that the Cup series races at the track which adds to the specialness of the weekend and can make setup a bit trickier if you haven’t done well here previously.
What makes this track most interesting is that the fastest way around the track is widely-known to be the outside groove. Right up against the wall is normally where you don’t want to be at most tracks as there just isn’t the grip to hold that line, but here it’s where all the grip is on the track. Certain drivers do better on those types of tracks on on those types of lines than others do and that will show in the track data below. Similar tracks to compare Homestead to are Atlanta, Chicago, and Kansas due to their size and the tire ware that happens at those tracks. Kansas is on the list because the fastest groove on the track is the highest, right up next to the wall, as Kyle Larson should in the second race there this year and the banking is very similar at these tracks to the banking at Homestead-Miami.
Unlike the previous tracks that have shown the same winners multiple times, this track doesn’t have that same distinction with the last time a repeat winner occurred being 2005 and 2006 with Greg Biffle. Each of the last five winners have been different and four of the five have started inside the top-five bringing the total up to 11 of 19 race winners starting inside the first five on the grid.
Track Data
Last Five Races at Homestead-Miami Speedway
| Avg. | Avg. | Avg. | Top | Top | Top | Top | Laps | |||
| Driver | Races | Start | Run Pos. | Finish | Wins | 5s | 10s | 15s | 20s | Led |
| Kevin Harvick | 5 | 6.8 | 5.4 | 4 | 1 | 4 | 5 | 5 | 5 | 187 |
| Kyle Busch | 5 | 6.6 | 9 | 11 | 1 | 2 | 4 | 4 | 4 | 85 |
| Martin Truex Jr | 5 | 7.4 | 10.2 | 14 | 1 | 2 | 2 | 3 | 4 | 81 |
| Denny Hamlin | 5 | 3.8 | 8.2 | 7.2 | 1 | 1 | 5 | 5 | 5 | 122 |
| Jimmie Johnson | 5 | 13.4 | 12.6 | 11 | 1 | 1 | 4 | 4 | 4 | 3 |
| Kyle Larson | 5 | 20.2 | 9 | 7.6 | 0 | 3 | 3 | 5 | 5 | 279 |
| Joey Logano | 5 | 9.2 | 6 | 7.6 | 0 | 2 | 4 | 4 | 5 | 78 |
| Brad Keselowski | 5 | 4.6 | 6.8 | 10.8 | 0 | 2 | 4 | 4 | 4 | 96 |
| Jamie McMurray | 5 | 19.4 | 17.4 | 13.2 | 0 | 2 | 2 | 4 | 4 | 0 |
| Matt Kenseth | 5 | 6.8 | 7.2 | 6 | 0 | 1 | 5 | 5 | 5 | 144 |
| Clint Bowyer | 5 | 20.8 | 20 | 18.2 | 0 | 1 | 2 | 3 | 3 | 0 |
| Ryan Newman | 5 | 12.8 | 13 | 14 | 0 | 1 | 2 | 2 | 4 | 0 |
| Paul Menard | 5 | 17.6 | 20 | 18.8 | 0 | 1 | 1 | 2 | 3 | 0 |
| Chase Elliott | 2 | 11.5 | 9 | 8 | 0 | 1 | 1 | 2 | 2 | 0 |
| Kurt Busch | 5 | 8.6 | 13.4 | 15 | 0 | 0 | 1 | 3 | 3 | 5 |
| AJ Allmendinger | 5 | 23.8 | 22.8 | 23.6 | 0 | 0 | 1 | 2 | 3 | 0 |
| Michael McDowell | 5 | 30 | 29.6 | 26.2 | 0 | 0 | 1 | 1 | 1 | 0 |
| Austin Dillon | 4 | 17 | 14.3 | 15.5 | 0 | 0 | 0 | 3 | 3 | 0 |
| Ricky Stenhouse Jr | 5 | 14.2 | 20.2 | 22.2 | 0 | 0 | 0 | 1 | 1 | 0 |
| Aric Almirola | 5 | 19.2 | 26 | 26.8 | 0 | 0 | 0 | 0 | 3 | 0 |
| David Ragan | 5 | 32.8 | 28.8 | 26.4 | 0 | 0 | 0 | 0 | 1 | 1 |
| Chris Buescher | 2 | 28 | 28 | 22 | 0 | 0 | 0 | 0 | 1 | 0 |
| Ryan Blaney | 3 | 8.3 | 25.3 | 24 | 0 | 0 | 0 | 0 | 1 | 0 |
| Alex Bowman | 3 | 31 | 28.3 | 25 | 0 | 0 | 0 | 0 | 1 | 0 |
| Erik Jones | 1 | 14 | 20 | 21 | 0 | 0 | 0 | 0 | 0 | 0 |
| Ty Dillon | 3 | 30.3 | 21.3 | 27.3 | 0 | 0 | 0 | 0 | 0 | 0 |
| Landon Cassill | 5 | 33.2 | 29.6 | 28.2 | 0 | 0 | 0 | 0 | 0 | 0 |
| Corey LaJoie | 1 | 34 | 33 | 31 | 0 | 0 | 0 | 0 | 0 | 0 |
| Matt DiBenedetto | 3 | 33 | 32.7 | 31.3 | 0 | 0 | 0 | 0 | 0 | 0 |
| Daniel Suarez | 1 | 10 | 17 | 34 | 0 | 0 | 0 | 0 | 0 | 0 |
| JJ Yeley | 3 | 34 | 35.3 | 34.3 | 0 | 0 | 0 | 0 | 0 | 0 |
| Regan Smith | 1 | 35 | 28 | 38 | 0 | 0 | 0 | 0 | 0 | 0 |
| BJ McLeod | 0 | 0 | 0 | 0 | 0 | 0 | 0 | 0 | 0 | 0 |
| Bubba Wallace | 0 | 0 | 0 | 0 | 0 | 0 | 0 | 0 | 0 | 0 |
| Kyle Weatherman | 0 | 0 | 0 | 0 | 0 | 0 | 0 | 0 | 0 | 0 |
| Ross Chastain | 0 | 0 | 0 | 0 | 0 | 0 | 0 | 0 | 0 | 0 |
| Tanner Berryhill | 0 | 0 | 0 | 0 | 0 | 0 | 0 | 0 | 0 | 0 |
| Timmy Hill | 0 | 0 | 0 | 0 | 0 | 0 | 0 | 0 | 0 | 0 |
| William Byron | 0 | 0 | 0 | 0 | 0 | 0 | 0 | 0 | 0 | 0 |
| Fast | Top 15 | Laps | Avg. | High | Low | Pos | Laps Led | High to | Low to | |
| Driver | Laps | Rate | Comp. | Rating | Rating | Rating | Diff | Pts./Race | Avg Rating | Avg Rating |
| Kevin Harvick | 110 | 94% | 1336 | 117.6 | 132.7 | 91.7 | 2.80 | 9.35 | 15.1 | 25.9 |
| Kyle Busch | 148 | 87% | 1315 | 110.9 | 136.1 | 73.7 | -4.40 | 4.25 | 25.2 | 37.2 |
| Martin Truex Jr | 34 | 83% | 1325 | 94.8 | 129.3 | 70.2 | -6.60 | 4.05 | 34.5 | 24.6 |
| Denny Hamlin | 56 | 92% | 1336 | 107.3 | 130 | 90.2 | -3.40 | 6.10 | 22.7 | 17.1 |
| Jimmie Johnson | 53 | 73% | 1333 | 95.4 | 109.9 | 63.4 | 2.40 | 0.15 | 14.5 | 32 |
| Kyle Larson | 181 | 77% | 1336 | 109.3 | 140.1 | 77 | 12.60 | 13.95 | 30.8 | 32.3 |
| Joey Logano | 39 | 98% | 1336 | 108.7 | 123.5 | 98.7 | 1.60 | 3.90 | 14.8 | 10 |
| Brad Keselowski | 41 | 94% | 1325 | 106.5 | 124.3 | 86 | -6.20 | 4.80 | 17.8 | 20.5 |
| Jamie McMurray | 6 | 52% | 1333 | 79 | 89.7 | 51.4 | 6.20 | 0.00 | 10.7 | 27.6 |
| Matt Kenseth | 54 | 98% | 1336 | 108.1 | 139.9 | 96 | 0.80 | 7.20 | 31.8 | 12.1 |
| Clint Bowyer | 3 | 54% | 1112 | 73.1 | 97.2 | 32.8 | 2.60 | 0.00 | 24.1 | 40.3 |
| Ryan Newman | 2 | 66% | 1332 | 85.4 | 108.2 | 77.7 | -1.20 | 0.00 | 22.8 | 7.7 |
| Paul Menard | 8 | 25% | 1295 | 70 | 87.1 | 55.6 | -1.20 | 0.00 | 17.1 | 14.4 |
| Chase Elliott | 11 | 98% | 535 | 97 | 98.5 | 95.5 | 3.50 | 0.00 | 1.5 | 1.5 |
| Kurt Busch | 22 | 60% | 1334 | 85.6 | 99.5 | 74.1 | -6.40 | 0.25 | 13.9 | 11.5 |
| AJ Allmendinger | 12 | 16% | 1292 | 66 | 75.9 | 48.9 | 0.20 | 0.00 | 9.9 | 17.1 |
| Michael McDowell | 11 | 2% | 1127 | 51.4 | 73.2 | 27.8 | 3.80 | 0.00 | 21.8 | 23.6 |
| Austin Dillon | 9 | 70% | 1069 | 81.8 | 89.8 | 67.5 | 1.50 | 0.00 | 8 | 14.3 |
| Ricky Stenhouse Jr | 13 | 31% | 1328 | 68.2 | 82.3 | 58.6 | -8.00 | 0.00 | 14.1 | 9.6 |
| Aric Almirola | 16 | 11% | 1221 | 62.2 | 78.4 | 44 | -7.60 | 0.00 | 16.2 | 18.2 |
| David Ragan | 13 | 0% | 1327 | 48.6 | 58 | 38.3 | 6.40 | 0.05 | 9.4 | 10.3 |
| Chris Buescher | 1 | 1% | 531 | 47.3 | 50.6 | 44 | 6.00 | 0.00 | 3.3 | 3.3 |
| Ryan Blaney | 9 | 26% | 795 | 61.8 | 81.1 | 49.5 | -15.70 | 0.00 | 19.3 | 12.3 |
| Alex Bowman | 5 | 1% | 797 | 55.7 | 71.6 | 40.5 | 6.00 | 0.00 | 15.9 | 15.2 |
| Erik Jones | 0 | 0% | 265 | 67.3 | 67.3 | 67.3 | -7.00 | 0.00 | 0 | 0 |
| Ty Dillon | 3 | 15% | 788 | 59.3 | 63 | 53.2 | 3.00 | 0.00 | 3.7 | 6.1 |
| Landon Cassill | 2 | 1% | 1325 | 44.4 | 47.5 | 39.7 | 5.00 | 0.00 | 3.1 | 4.7 |
| Corey LaJoie | 0 | 1% | 261 | 34.7 | 34.7 | 34.7 | 3.00 | 0.00 | 0 | 0 |
| Matt DiBenedetto | 8 | 0% | 790 | 38.2 | 40.7 | 33.7 | 1.70 | 0.00 | 2.5 | 4.5 |
| Daniel Suarez | 0 | 73% | 225 | 65.2 | 65.2 | 65.2 | -24.00 | 0.00 | ||
| JJ Yeley | 0 | 1% | 782 | 36.7 | 40.5 | 30 | -0.30 | 0.00 | 3.8 | 6.7 |
| Regan Smith | 0 | 0% | 255 | 38.7 | 38.7 | 38.7 | -3.00 | 0.00 | 0 | 0 |
| BJ McLeod | 0 | 0% | 0 | 0 | 0 | 0 | 0.00 | 0 | 0 | |
| Bubba Wallace | 0 | 0% | 0 | 0 | 0 | 0 | 0.00 | 0 | 0 | |
| Kyle Weatherman | 0 | 0% | 0 | 0 | 0 | 0 | 0.00 | 0 | 0 | |
| Ross Chastain | 0 | 0% | 0 | 0 | 0 | 0 | 0.00 | 0 | 0 | |
| Tanner Berryhill | 0 | 0% | 0 | 0 | 0 | 0 | 0.00 | 0 | 0 | |
| Timmy Hill | 0 | 0% | 0 | 0 | 0 | 0 | 0.00 | 0 | 0 | |
| William Byron | 0 | 0% | 0 | 0 | 0 | 0 | 0.00 | 0 | 0 |
Top-15 Drivers Over Last 10 Races at Homestead-Miami
| Avg. | Avg. | Avg. | Top | Top | Top | Top | Laps | |||
| Driver | Races | Start | Run Pos. | Finish | Wins | 5s | 10s | 15s | 20s | Led |
| Denny Hamlin | 10 | 17 | 10.7 | 9.7 | 2 | 2 | 7 | 9 | 9 | 193 |
| Kevin Harvick | 10 | 11.7 | 7.2 | 4.4 | 1 | 7 | 10 | 10 | 10 | 256 |
| Martin Truex Jr | 10 | 9.5 | 9.5 | 10.9 | 1 | 3 | 6 | 8 | 9 | 159 |
| Jimmie Johnson | 10 | 12.3 | 12.3 | 14.5 | 1 | 3 | 6 | 7 | 7 | 65 |
| Kyle Busch | 10 | 13.1 | 9 | 14.1 | 1 | 3 | 6 | 6 | 7 | 293 |
| Clint Bowyer | 10 | 18.1 | 15.2 | 12.7 | 0 | 3 | 5 | 8 | 8 | 1 |
| Jamie McMurray | 10 | 15.8 | 15.6 | 14.2 | 0 | 3 | 3 | 6 | 8 | 0 |
| Kyle Larson | 5 | 20.2 | 9 | 7.6 | 0 | 3 | 3 | 5 | 5 | 279 |
| Matt Kenseth | 10 | 10.1 | 8.5 | 9.9 | 0 | 2 | 7 | 8 | 9 | 235 |
| Brad Keselowski | 10 | 10.7 | 12.8 | 15 | 0 | 2 | 4 | 6 | 7 | 107 |
| Joey Logano | 9 | 14.8 | 13.2 | 14.9 | 0 | 2 | 4 | 5 | 7 | 78 |
| Ryan Newman | 10 | 15.6 | 14 | 13.6 | 0 | 2 | 4 | 5 | 7 | 3 |
| AJ Allmendinger | 9 | 21.3 | 19.7 | 17.7 | 0 | 1 | 3 | 6 | 7 | 0 |
| Kurt Busch | 10 | 13.8 | 18.4 | 18.3 | 0 | 1 | 3 | 5 | 6 | 48 |
| Aric Almirola | 8 | 20.6 | 23.3 | 22.5 | 0 | 1 | 2 | 2 | 5 | 0 |
| Fast | Top 15 | Laps | Avg. | High | Low | Pos. | Laps Led | Rating | |
| Driver | Laps | Rate | Comp. | Rating | Rating | Rating | Diff. | Pts/Race | Range |
| Denny Hamlin | 96 | 74% | 2670 | 100.2 | 130 | 63 | 7.30 | 4.83 | 67 |
| Kevin Harvick | 168 | 89% | 2671 | 112.3 | 132.7 | 83.3 | 7.30 | 6.40 | 49.4 |
| Martin Truex Jr | 142 | 82% | 2660 | 101.7 | 129.3 | 70.2 | -1.40 | 3.98 | 59.1 |
| Jimmie Johnson | 106 | 74% | 2619 | 98.3 | 119.4 | 63.4 | -2.20 | 1.63 | 56 |
| Kyle Busch | 231 | 85% | 2623 | 105.6 | 142.5 | 73.7 | -1.00 | 7.33 | 68.8 |
| Clint Bowyer | 18 | 64% | 2447 | 85.1 | 118.5 | 32.8 | 5.40 | 0.03 | 85.7 |
| Jamie McMurray | 12 | 56% | 2667 | 82.4 | 104.5 | 51.4 | 1.60 | 0.00 | 53.1 |
| Kyle Larson | 181 | 77% | 1336 | 109.3 | 140.1 | 77 | 12.60 | 13.95 | 63.1 |
| Matt Kenseth | 94 | 89% | 2669 | 104.2 | 139.9 | 71.7 | 0.20 | 5.88 | 68.2 |
| Brad Keselowski | 71 | 67% | 2657 | 90.4 | 124.3 | 44 | -4.30 | 2.68 | 80.3 |
| Joey Logano | 42 | 62% | 2303 | 89 | 123.5 | 51.1 | -0.10 | 2.17 | 72.4 |
| Ryan Newman | 9 | 66% | 2666 | 84 | 108.2 | 49.1 | 2.00 | 0.08 | 59.1 |
| AJ Allmendinger | 14 | 30% | 2360 | 74.3 | 102 | 48.9 | 3.60 | 0.00 | 53.1 |
| Kurt Busch | 57 | 49% | 2562 | 77.8 | 123.2 | 38.1 | -4.50 | 1.20 | 85.1 |
| Aric Almirola | 38 | 30% | 2020 | 69.4 | 103.2 | 41 | -1.90 | 0.00 | 62.2 |
Top-15 Drivers at Similar Tracks (Atlanta, Chicago, Homestead, Kansas)
| Avg. | Avg. | Avg. | Top | Top | Top | Top | Laps | |||
| Driver | Races | Start | Run Pos. | Finish | Wins | 5s | 10s | 15s | 20s | Led |
| Martin Truex Jr | 20 | 10.7 | 9.3 | 8.6 | 5 | 10 | 13 | 17 | 18 | 472 |
| Kevin Harvick | 20 | 5.2 | 5.7 | 7.8 | 4 | 12 | 16 | 17 | 19 | 1565 |
| Jimmie Johnson | 20 | 18.2 | 11.9 | 12.2 | 3 | 5 | 9 | 14 | 16 | 267 |
| Brad Keselowski | 20 | 7.6 | 8.7 | 10.8 | 2 | 7 | 15 | 17 | 17 | 291 |
| Kyle Busch | 19 | 7.1 | 8.4 | 8.9 | 2 | 7 | 15 | 16 | 18 | 599 |
| Denny Hamlin | 20 | 10.1 | 10.4 | 11.1 | 2 | 7 | 14 | 16 | 17 | 217 |
| Chase Elliott | 13 | 13.6 | 10.4 | 10.8 | 1 | 6 | 8 | 10 | 11 | 165 |
| Kyle Larson | 20 | 15.2 | 11.3 | 11.3 | 0 | 9 | 13 | 15 | 16 | 416 |
| Joey Logano | 20 | 10.1 | 8 | 9 | 0 | 7 | 15 | 17 | 18 | 273 |
| Matt Kenseth | 17 | 11.2 | 10.6 | 10.9 | 0 | 5 | 13 | 14 | 15 | 371 |
| Kurt Busch | 19 | 10.4 | 11.8 | 11.9 | 0 | 3 | 8 | 13 | 17 | 202 |
| Clint Bowyer | 20 | 20.3 | 18.2 | 19.1 | 0 | 3 | 5 | 10 | 12 | 25 |
| Ryan Blaney | 14 | 13.4 | 14.1 | 16.1 | 0 | 3 | 4 | 7 | 10 | 176 |
| Jamie McMurray | 20 | 14.8 | 16.2 | 17.7 | 0 | 2 | 6 | 11 | 14 | 33 |
| Ryan Newman | 20 | 11 | 15.2 | 18.7 | 0 | 2 | 5 | 9 | 12 | 23 |
| Fast | Top 15 | Laps | Avg. | High | Low | Pos | Laps Led | Rating | |
| Driver | Laps | Rate | Comp. | Rating | Rating | Rating | Diff. | Pts./Race | Range |
| Martin Truex Jr | 390 | 85% | 5637 | 104.5 | 144.9 | 69.5 | 2.10 | 5.90 | 75.4 |
| Kevin Harvick | 780 | 90% | 5590 | 122 | 146.1 | 76.9 | -2.60 | 19.56 | 69.2 |
| Jimmie Johnson | 239 | 71% | 5636 | 93.1 | 126.7 | 54.7 | 6.00 | 3.34 | 72 |
| Brad Keselowski | 278 | 89% | 5522 | 102.7 | 130.4 | 66.9 | -3.20 | 3.64 | 63.5 |
| Kyle Busch | 426 | 83% | 5302 | 108.3 | 136.1 | 68.7 | -1.80 | 7.88 | 67.4 |
| Denny Hamlin | 170 | 82% | 5462 | 96.9 | 130 | 67 | -1.00 | 2.71 | 63 |
| Chase Elliott | 156 | 83% | 3641 | 98.4 | 129.1 | 73.1 | 2.80 | 3.17 | 56 |
| Kyle Larson | 384 | 75% | 5444 | 97.6 | 140.1 | 51.1 | 3.90 | 5.20 | 89 |
| Joey Logano | 202 | 89% | 5581 | 103 | 126.9 | 59.3 | 1.10 | 3.41 | 67.6 |
| Matt Kenseth | 155 | 79% | 4701 | 97.6 | 139.9 | 45.8 | 0.30 | 5.46 | 94.1 |
| Kurt Busch | 127 | 73% | 5318 | 91 | 125.6 | 72.8 | -1.50 | 2.66 | 52.8 |
| Clint Bowyer | 85 | 53% | 5364 | 73.8 | 109.7 | 32.8 | 1.20 | 0.31 | 76.9 |
| Ryan Blaney | 158 | 65% | 3890 | 85.5 | 128.4 | 49.5 | -2.70 | 3.14 | 78.9 |
| Jamie McMurray | 31 | 54% | 5454 | 78.5 | 113.5 | 46.7 | -2.90 | 0.41 | 66.8 |
| Ryan Newman | 79 | 57% | 5428 | 81 | 108.2 | 49 | -7.70 | 0.29 | 59.2 |
Momentum
| Avg. | Avg. | Avg. | Top | Top | Top | Top | Pos | Avg. | |||
| Driver | Races | Start | Run Pos. | Finish | Wins | 5s | 10s | 15s | 20s | Diff. | Rating |
| Joey Logano | 5 | 9.6 | 9.4 | 10.8 | 1 | 3 | 4 | 4 | 4 | -1.2 | 108.7 |
| Kyle Busch | 5 | 6.6 | 9 | 10 | 1 | 3 | 3 | 3 | 4 | -3.4 | 106.5 |
| Aric Almirola | 5 | 6.8 | 8.8 | 6.8 | 1 | 2 | 4 | 5 | 5 | 0 | 101.6 |
| Kevin Harvick | 5 | 4.2 | 6.2 | 11.2 | 1 | 2 | 3 | 4 | 4 | -7 | 114.8 |
| Chase Elliott | 5 | 11 | 9.2 | 13.6 | 1 | 1 | 3 | 3 | 3 | -2.6 | 99.3 |
| Kyle Larson | 5 | 20 | 14 | 11.8 | 0 | 3 | 3 | 4 | 4 | 8.2 | 89.8 |
| Brad Keselowski | 5 | 9.4 | 8.8 | 10.4 | 0 | 2 | 3 | 4 | 4 | -1 | 102.3 |
| Martin Truex Jr | 5 | 16.4 | 12.8 | 10.8 | 0 | 2 | 3 | 4 | 4 | 5.6 | 91.3 |
| Erik Jones | 5 | 12.2 | 14.4 | 11.8 | 0 | 2 | 3 | 3 | 4 | 0.4 | 86.6 |
| Denny Hamlin | 5 | 7.6 | 13.8 | 12.6 | 0 | 2 | 2 | 4 | 4 | -5 | 88.1 |
| Ryan Blaney | 5 | 6.4 | 8.8 | 18.4 | 0 | 1 | 2 | 2 | 3 | -12 | 101 |
| Ricky Stenhouse Jr | 5 | 13 | 18.6 | 17.2 | 0 | 1 | 1 | 2 | 4 | -4.2 | 75.8 |
| Clint Bowyer | 5 | 7.2 | 15.6 | 19.4 | 0 | 1 | 1 | 2 | 2 | -12.2 | 80.2 |
| Kurt Busch | 5 | 7.8 | 9 | 15.4 | 0 | 0 | 2 | 3 | 4 | -7.6 | 103.8 |
| Austin Dillon | 5 | 22 | 16.8 | 15.2 | 0 | 0 | 2 | 3 | 4 | 6.8 | 78.2 |
Points Changes at Homestead-Miami
DraftKings
| 17 Race | Season | DK Pts +/- | |
| Driver | Total | Avg DK Pts. | Season AVG |
| Kyle Larson | 115.25 | 43.26 | 72.0 |
| Martin Truex Jr | 76 | 48.67 | 27.3 |
| Kyle Busch | 82.75 | 60.92 | 21.8 |
| David Ragan | 41.5 | 23.23 | 18.3 |
| Ryan Newman | 45.5 | 27.66 | 17.8 |
| AJ Allmendinger | 42 | 26.26 | 15.7 |
| Chase Elliott | 53 | 38.18 | 14.8 |
| Austin Dillon | 40.5 | 29.92 | 10.6 |
| Jamie McMurray | 34 | 24.01 | 10.0 |
| Joey Logano | 51.5 | 42.28 | 9.2 |
| Chris Buescher | 33.5 | 25.86 | 7.6 |
| Matt Kenseth | 33 | 25.84 | 7.2 |
| Landon Cassill | 26 | 19.43 | 6.6 |
| Paul Menard | 28 | 25.86 | 2.1 |
| Corey LaJoie | 16 | 15 | 1.0 |
| Brad Keselowski | 39.75 | 39.07 | 0.7 |
| Ty Dillon | 24 | 23.95 | 0.1 |
| Michael McDowell | 20.5 | 21.04 | -0.5 |
| Ricky Stenhouse Jr | 24 | 24.54 | -0.5 |
| Clint Bowyer | 36 | 39.09 | -3.1 |
| Matt DiBenedetto | 16.5 | 20.57 | -4.1 |
| Kevin Harvick | 57 | 66.26 | -9.3 |
| Denny Hamlin | 28 | 37.51 | -9.5 |
| Aric Almirola | 28.5 | 39.37 | -10.9 |
| Jimmie Johnson | 18 | 31.68 | -13.7 |
| Erik Jones | 16 | 31.57 | -15.6 |
| Kurt Busch | 8 | 39.45 | -31.5 |
| Ryan Blaney | -1.5 | 33.89 | -35.4 |
| Daniel Suarez | -14 | 29.02 | -43.0 |
| AVG. +/- | 14.5 |
FanDuel
| 17 Race | 18 Season | FD Pts +/- | |
| Driver | Total | Avg FD Pts. | Season AVG |
| Kyle Larson | 81.2 | 56.88 | 24.32 |
| Martin Truex Jr | 78 | 57.99 | 20.01 |
| Chase Elliott | 69.2 | 55.19 | 14.01 |
| AJ Allmendinger | 59.6 | 45.62 | 13.98 |
| Ryan Newman | 63.2 | 49.63 | 13.57 |
| David Ragan | 57 | 45.78 | 11.22 |
| Matt Kenseth | 57.7 | 46.58 | 11.12 |
| Joey Logano | 68.2 | 58.48 | 9.72 |
| Austin Dillon | 59.7 | 50.85 | 8.85 |
| Kyle Busch | 71.5 | 63.40 | 8.10 |
| Jamie McMurray | 54.6 | 47.43 | 7.17 |
| Landon Cassill | 47 | 39.91 | 7.09 |
| Brad Keselowski | 59.8 | 53.67 | 6.13 |
| Corey LaJoie | 37.6 | 31.50 | 6.10 |
| Chris Buescher | 52 | 46.78 | 5.22 |
| Paul Menard | 51 | 46.29 | 4.71 |
| Clint Bowyer | 57.7 | 54.64 | 3.06 |
| Michael McDowell | 43 | 40.33 | 2.67 |
| Kevin Harvick | 66.2 | 63.69 | 2.51 |
| Ricky Stenhouse Jr | 48.1 | 46.39 | 1.71 |
| Denny Hamlin | 54.7 | 55.17 | -0.47 |
| Ty Dillon | 44.4 | 45.01 | -0.61 |
| Matt DiBenedetto | 37.8 | 41.22 | -3.42 |
| Aric Almirola | 50.5 | 55.95 | -5.45 |
| Erik Jones | 43 | 52.66 | -9.66 |
| Jimmie Johnson | 37.9 | 50.60 | -12.70 |
| Kurt Busch | 38.5 | 55.22 | -16.72 |
| Ryan Blaney | 29.4 | 50.97 | -21.57 |
| Daniel Suarez | 17.5 | 48.26 | -30.76 |
| AVG +/- | 9.00 |
Top-10 and Bottom-10 Values Drivers
DraftKings
| Rank | Driver | Value | Rank | Driver | Value |
|---|---|---|---|---|---|
| 1 | Kevin Harvick | 5.30 | 39 | Timmy Hill | 2.28 |
| 2 | Kyle Busch | 5.16 | 38 | Kyle Weatherman | 2.60 |
| 3 | Regan Smith | 4.95 | 37 | BJ McLeod | 2.91 |
| 4 | Aric Almirola | 4.69 | 36 | William Byron | 3.00 |
| 5 | Clint Bowyer | 4.34 | 35 | Corey Lajoie | 3.06 |
| 6 | Kyle Larson | 4.33 | 34 | JJ Yeley | 3.28 |
| 7 | Martin Truex Jr | 4.31 | 33 | Ricky Stenhouse Jr | 3.36 |
| 8 | Kurt Busch | 4.29 | 32 | Jamie McMurray | 3.38 |
| 9 | Denny Hamlin | 4.26 | 31 | Alex Bowman | 3.59 |
| 10 | Chris Buescher | 4.24 | 30 | Ross Chastain | 3.60 |
FanDuel
| Rank | Driver | Value | Rank | Driver | Value |
|---|---|---|---|---|---|
| 1 | Regan Smith | 11.64 | 37 | Martin Truex Jr. | 4.30 |
| 2 | Matt DiBenedetto | 10.30 | 36 | Joey Logano | 4.33 |
| 3 | Landon Cassill | 9.98 | 35 | Kevin Harvick | 4.39 |
| 4 | Ross Chastain | 9.97 | 34 | Kyle Larson | 4.55 |
| 5 | J.J. Yeley | 9.48 | 33 | Brad Keselowski | 4.59 |
| 6 | Kyle Weatherman | 8.74 | 32 | Kyle Busch | 4.70 |
| 7 | Michael McDowell | 8.07 | 31 | Denny Hamlin | 4.80 |
| 8 | Corey LaJoie | 7.88 | 30 | Chase Elliott | 5.02 |
| 9 | Bubba Wallace | 7.68 | 29 | Kurt Busch | 5.16 |
| 10 | David Ragan | 7.63 | 28 | Ryan Blaney | 5.31 |
Drivers To Watch This Week
Kevin Harvick: Based on the salaries he’s listed at on both sites, it’s fair to say that Harvick is the favorite this weekend for the Championship. He was the favorite last week at Phoenix until he had a flat tire and a pit penalty stemming made his day tougher and ultimately kept him from the win. At Miami specifically he has a win here back in 2014 along with four top-fives in the last five races, five top-10s, 187 laps led and 110 fastest laps. His average finish mark of 4.0 in that span is the best in the field as well and that doesn’t even include the 4.4 average finish in the last 10 races with 10 top-10s and seven top-fives. Clearly given the car he’s had all year and his history here there are a lot of reasons he’s the most-expensive driver this week…again.
Kyle Busch: Busch might have the best momentum in the field after locking down a win last weekend at Phoenix. Busch has a win here, in 2015, along with two top-fives and four top-10s in the last five races with 85 laps led and 148 fastest laps. The 18-car has been equal to the 4-car pretty much all season though his 17 top-three finishes this year are the best on the year and in his career. But in an interesting twist he’s only led one lap in his last four 1.5 mile races this season which isn’t a comforting stat heading into a winner-take-all 1.5-mile race.
Martin Truex Jr.: Truex is the defending race winner here and thus the defending Champion of the Cup series and is now coming into his final race ever for Furniture Row Racing with it shutting down at season’s end. He has clearly been dominant at this distance in the past two seasons but he has shown some vulnerability at this distance of late especially in the playoffs. He has just two top-10s here in the last five races with 81 laps led and 34 fastest laps which is aside from the win, the worst stat package of the Championship four.
Joey Logano: Logano was running near the front of the pack last week, again, before a tire went down and spun him into the wall and ended his day early, though not his run for a title. Logano has been the second-fastest car on the track in the playoffs, only being bested by Kevin Harvick and at Miami previously he has two top-fives and four top-10s in the last five races with 78 laps led and 39 fastest laps. His advantage this week over the others is that he’s been able to prepare his car for two weeks already whereas the others weren’t locked into until mid-race at Phoenix. The way the sites did the pricing, there isn’t much of a difference between the three Championship drivers so Logano remains a sneaky pick once more.
Kyle Larson: The hope is that one of these days Larson will actually qualify for the Championship race and then he can really put on a show in the run for a title. Until then though, we just have to settle for him putting on a show without that really big trophy coming to him. In the last five races here he has three top-fives, three top-10s, 279 laps led, and 181 fastest laps while posting a great +12.6 position differential mark. He is the driver that really excels at driving up near the wall and gaining the most speed possible there, the flip side is that it can sometimes lead to disaster if he tries to get too much and rubs the wall instead.
Denny Hamlin: Hamlin might be a bit of a sleeper this week since he hasn’t been in the playoff picture at all for quite some time and is in fact winless this year. That being said, the 11-car has shown signs of life recently and was running near the front at Phoenix when he got loose and took out Kurt Busch and Chase Elliott ending their Championship hopes. However at Homestead-Miami he has a win, a top-five, and five top-10s in the last five races here with 122 laps led and 56 fastest laps while also being one of only five drivers over that span (to run all five races) to post a 90+% top-15 rate. Hamlin is a bit discounted this week but is still hungry for that win to keep his streak of seasons with a win alive.