
2019 MLB Draft Guide: Understanding Projections & Category Targets

Published: Feb 07, 2019

UNDERSTANDING PROJECTIONS & CATEGORY TARGETS
It was 30-years ago today, Wolfman was asked to play.
Well, maybe not to the day, but I started playing Rotisserie baseball in 1989. After reading every edition of the National and programming the SportsTicker wire feed for an IBM company called PRODIGY, I was ready for the game that combined numbers and my favorite sport. My boss, at the time, roped me into playing with a great group that still exists, the PRODIGY Rotisserie League or ProdRot for short.
Since 2002, Glenn Colton and I began partnering in leagues. Understanding what is going on within each team, each player’s dynamic, their history came into play when we developed the SMART System. It took into account all the numbers/trends and coupled them with the real-world trends. plus over the years we have added in a lot of the higher-end numbers to get the full picture of the player and what his value is by applying the numbers and then a set of rules to that evaluation.
My love of the numbers is not a secret in any of my circles. My decades long frustration with the fact that numbers cannot simply be accurate for projections haunts me.
So, after 30 years playing fantasy baseball I came to the conclusion that projections and category targeting are incredibly important to our success in drafting winning fantasy baseball teams, but you need to use them carefully knowing that projections are flawed in many ways. Specifically, (1) the game has changed and projectionists have not caught up; (2) the human element of players can never be included like when a player is traded or a contract year is upon us; (3) upside cannot be included; (4) hype is often included way too much; (5) many projections are a regurgitation of the previous year's stats with minor changes and most consensus projections look like that.
So let's dive in deeper to explain all these disclaimers and show how to use projections and categories!
The Changing Game
When I wrote a similar column to this last year, it taught me about the trend of home runs and stolen bases. It made me hyper-sensitive to stolen bases and less sensitive to home runs. Every team I drafted had enough speed. I drafted steals only players at the end of all my drafts. Also, worked hard on the Colton & The Wolfman teams to convince Glenn Colton that we had to do the same thing. We focused on a $1 or $2 Aldaberto “don’t call me Raul” Mondesi. We drafted him in several leagues and had to wait with him in reserve until he exploded on the scene and stole 32 bases. That was 1.3% of all steals in the majors last year. Crazy. In 2018, there were only 2,474 stolen bases which was drastically down from only four years earlier when in 2014, there was a whopping 2,764 stolen bases. That is a drop of 10.5% in only four years. Therefore, you must drastically change your targets and the way you play for speed.
Similar trends took place last year as for the first time in five years, offense went down. There were 430 less home runs hit last year plus both runs and RBI went down significantly while strikeouts rose by about the same level they had in each of the last two seasons.
A major flaw in projections is that they do not consider the changing game. Here are three trends in Major League Baseball that affect what we do for projections: (1) hitters are sacrificing batting average for home runs; (2) more teams are employing defensive tactics like the shift which is lowering batting averages; (3) starting pitchers are throwing less innings because of the individual roles in bullpens that are adopted by almost all MLB teams.
Let’s look at the offense only right now as that is the most projectible and where projections are the most helpful.
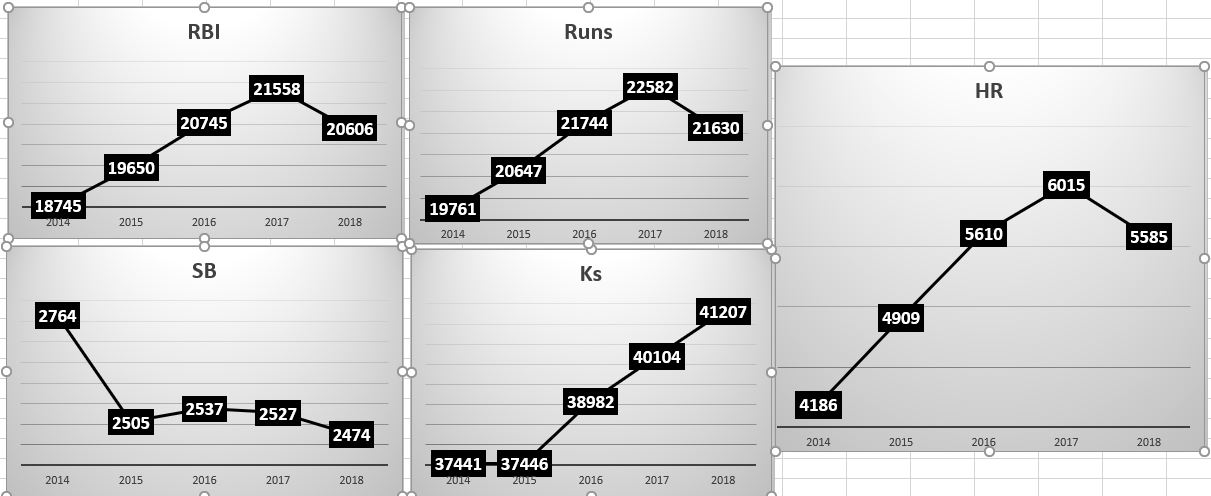
When we take a close look at this, we can see that the counting numbers went down last year along with home runs. Strikeouts have risen (that means they have risen for all pitchers combined too). However, stolen bases have gone down for the fifth year in a row and are now more than 2.25 times as valuable as home runs. So, when setting up your category targets or looking at projections to see who to take next or to bid on, you need to know that home runs are easier to acquire than stolen bases.
Upside is always lost with projections.
All projectionists try to come up with the most likely performance of all the players. This causes many to miss on the outliers. Getting more players right means that they will have a wider margin of misses on the high-end and low-end of the spectrum.
For example, projections last year compared to actuals had the following results for home runs hitters:
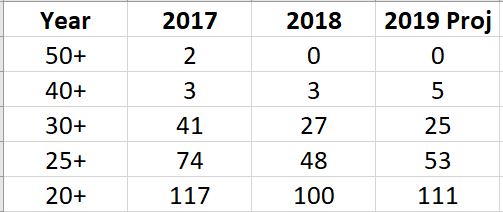
Seeing the trend of stats vs projections shows exactly what we pointed out. Thirty players projected to have more than 30 home runs. That is the same number that did it in 2018. So be careful that you ALWAYS look for UPSIDE in your picks and then let the projections define your targeting. That way you will always have way more stats than your projections sheet.
Hype and Regurgitation
No this is not a frat party joke. Players who have not played long in the league can sometimes get overhyped with small sample sizes. Those players projections are skewed by group think. For instance, the group think on Vladimir Guerrero Jr. is CRAZY. Didn’t anyone ever hear of Kevin Maas or Sean Burroughs? Look them up. They had crazy hype like this. One in ten turns out to be worth the hype and you overpay on nine of them. He is being drafted in the fourth round or earlier now and his likely production is about 15 home runs in 300 at bats.
Regurgitation is bad. Really bad. Don’t use last year’s stats as your projections for all but new players.
Support Your League Rules
Make sure your projections have the statistics that your league uses. If your league uses holds, make sure you start with projections that have holds. If your league uses quality starts (QS), make sure you start with projections that have QS.
Using Projections for Targeting Players
Now, why are we doing this? Well, it is to learn more about the players that you should target and how to build your roster. Here is how you should use projections to target players:
First, review projections by sorting them by each category that your league uses. Review the players from a lens of them helping your team in that category. Look for players that others or experts are not high on and take down their names. Getting bargains that help you in tough categories like stolen bases are important for you to know about. For instance, as of this writing, Kevin Kiermaier is projected for 19 stolen bases. This could be helpful from a guy who will come late and in auctions for about $4.
Using Projections for Targeting Categories
So now we understand the changing game and how to decide on your projections. Now, we connect that to the categories. Remember, knowledge is power.
Here are some rules about setting your category targets:
- Don’t Look at Winner for Targets: Look at Top 25% for your target. Finishing in the Top 25% in all categories makes you a winner in your league.
- Category dominators: Look at players who are Category dominators and consider them when potentially down against your targets.
- Get Ks & SBs from Every Player: When targeting hitters, make sure that you get some.
- Don’t Dump Categories: Only the best players can win this way. I am not one of them. Think of myself as top 10%, but it takes an incredible amount of skill and effort both in the draft and in-season. If that is you, then why the heck are you reading my column?
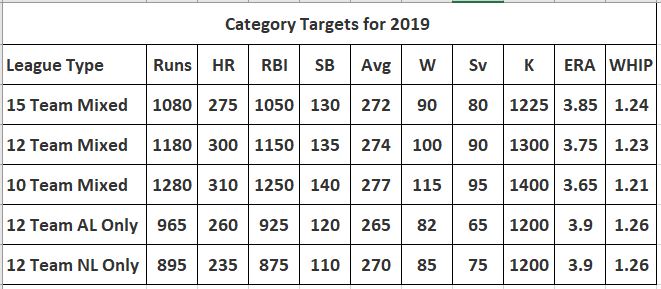
Here is a chart that specifies the targets that I use in the leagues that I play in. Again, you should examine your leagues to see if there are anomalies based on league members dumping categories or playing in a different way than the leagues that I play in.
Using a Tracking Sheet for Projections & Targeting Categories
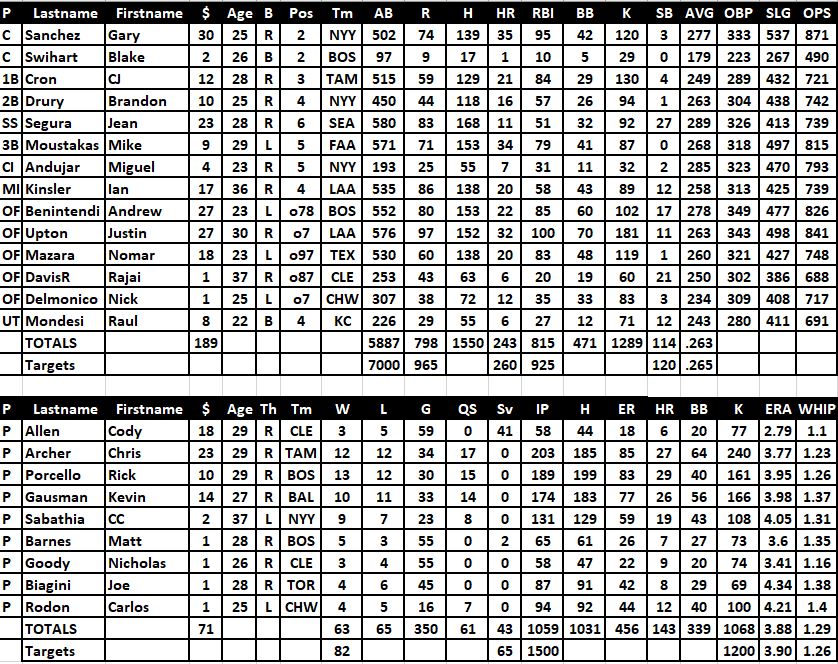
After all these years, I still use some complicated tracking spreadsheets. They are created and augmented year after year, but you can start simple, but just having a sheet with your players and the scoring categories that your league uses. This is a sample tracking sheet from LABR last year:
If you are more ambitious, you can use a track sheet that tracks all the teams each in separate by looking up projections when you type players in to the tracking sheet. This allows you to see the whole draft, all at one time and see who is also looking for a statistic. If you reach out to me at rick@fantasyalarm.com, I am glad to share a template for you to start with so you can set the stats look up correctly.

Nothing replaces your ability to understand what players will do best for your team by watching games, but numbers, specifically projections and some targets for your categories can guide you to having a more balanced team when the draft is over.
Remember, you cannot win the league at the draft, but if you are not watching the numbers, you could lose it.