
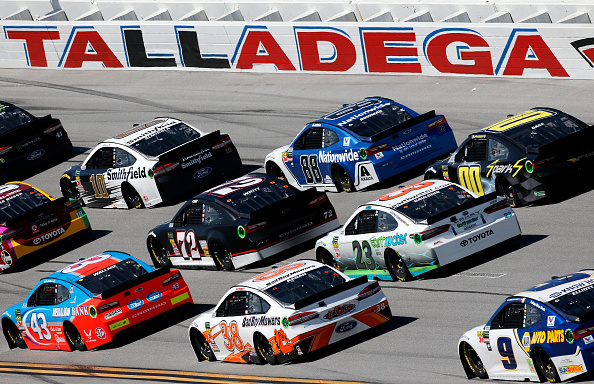

'DEGA! It’s a track name that strikes fear in the hearts of drivers, Crew Chiefs, and guys like me that have to try and correctly predict the drivers that will survive the race well enough to cross the finish line in some manner. It’s probably the wildest race of the year, aside from the earlier race at this track back in April. The wildness and unpredictability comes from the size, speed, and package used on and of the track.
Talladega is the longest track on the schedule at 2.66 miles per lap and thus it is also the fastest track on the schedule as well with speeds easily going over 205 mph. The banking is the steepest as well at an impressive 33 degrees in each four corners. To give you an idea of the steepness, if you were to stand on the outside wall in a corner and have a buddy stand on the apron, the vertical height difference between you two is as much as a three-story house.
To help control and reduce the speeds NASCAR considers this track as one of the restrictor plate tracks, along with Daytona. In layman’s terms the restrictor plate is a metal plate with holes in it that is placed in the engine to reduce the horsepower and thus the speed of the cars. The downside to this type of package is pack racing since everyone is pretty much going the same top speed and it’s hard to really pull away from other drivers and get a lead of any significance. Drafting and aerodynamics play a key role this week as it becomes really easy to spin people out if you get air on the wrong part of the car for even a blink of an eye, and that’s when the “Big One” often happens.
The “Big One” is a crash, or multiples in some cases, that involve a very large portion of the field, sometimes 20-25 cars at the same time, and it can wreak havoc with your lineups. Typically it happens in the middle of the field and about 2/3 to 3/4 of the way through the race when drivers are trying to position for stretch runs. It can also be brought on when one driver tries to block a move from another, like we saw at Daytona to start the year in the closing laps.
Of the 98 races at Dega all-time the average starting position for the winning driver is 8.02 and in the last 10 races that mark is 10.1 with the last five lowering it to 7.8. Generally speaking, 68% of winners have started in the top-10 all time and 50% have started inside the top-10. Those numbers are lower than other tracks, simply because of the shifting that happens in the field and the affect the accidents have. The fact that there are 39.5 lead changes in an average race here illustrates that fact though in the last five it’s dropped to 29.8 and in the last 10 it’s at 34.4 which is still a hefty amount for just 188 laps in the race without overtime.
Track Data
Last Four Races at Talladega Superspeedway
| Avg. | Avg. | Avg. | Top | Top | Top | Top | Laps | |||
| Driver | Races | Start | Run Pos. | Finish | Wins | 5s | 10s | 15s | 20s | Led |
| Joey Logano | 4 | 10 | 9 | 9.5 | 2 | 3 | 3 | 3 | 3 | 184 |
| Ricky Stenhouse Jr | 4 | 4.8 | 13.3 | 9.3 | 1 | 3 | 3 | 3 | 3 | 30 |
| Brad Keselowski | 4 | 5.3 | 11.3 | 19.8 | 1 | 1 | 2 | 2 | 2 | 149 |
| Aric Almirola | 4 | 28.5 | 18 | 6 | 0 | 2 | 4 | 4 | 4 | 0 |
| Kurt Busch | 4 | 7 | 12.8 | 9.3 | 0 | 2 | 3 | 3 | 3 | 8 |
| Denny Hamlin | 4 | 9.5 | 10.8 | 8.5 | 0 | 1 | 2 | 4 | 4 | 70 |
| Ryan Newman | 4 | 21.3 | 23.8 | 12.5 | 0 | 1 | 2 | 3 | 3 | 5 |
| Kevin Harvick | 4 | 12.8 | 13.8 | 13.5 | 0 | 1 | 2 | 2 | 3 | 27 |
| Chase Elliott | 4 | 4.8 | 10.5 | 15.3 | 0 | 1 | 1 | 2 | 3 | 35 |
| Kyle Busch | 4 | 14.8 | 16.3 | 18.3 | 0 | 1 | 1 | 2 | 2 | 54 |
| Trevor Bayne | 4 | 11.8 | 20.3 | 23.8 | 0 | 1 | 1 | 1 | 2 | 5 |
| Jamie McMurray | 4 | 22.5 | 21.8 | 21.5 | 0 | 1 | 1 | 1 | 2 | 0 |
| David Ragan | 4 | 28.5 | 21 | 12.5 | 0 | 0 | 3 | 3 | 3 | 0 |
| Paul Menard | 4 | 13 | 14.5 | 16 | 0 | 0 | 1 | 3 | 3 | 9 |
| Kyle Larson | 4 | 19.8 | 18.8 | 17.8 | 0 | 0 | 1 | 3 | 3 | 0 |
| Daniel Suarez | 3 | 11.7 | 16.3 | 14.7 | 0 | 0 | 1 | 2 | 3 | 12 |
| Jimmie Johnson | 4 | 17.8 | 11.8 | 16.8 | 0 | 0 | 1 | 2 | 2 | 3 |
| Gray Gaulding | 3 | 37.7 | 28.3 | 17.7 | 0 | 0 | 1 | 1 | 2 | 0 |
| Alex Bowman | 2 | 15 | 13 | 22 | 0 | 0 | 1 | 1 | 1 | 26 |
| AJ Allmendinger | 4 | 27.8 | 25.5 | 24.3 | 0 | 0 | 1 | 1 | 1 | 3 |
| Austin Dillon | 4 | 17.3 | 21 | 27.3 | 0 | 0 | 1 | 1 | 1 | 1 |
| Ty Dillon | 3 | 27.3 | 20.3 | 13 | 0 | 0 | 0 | 3 | 3 | 3 |
| Chris Buescher | 4 | 30 | 22.8 | 16.3 | 0 | 0 | 0 | 2 | 3 | 1 |
| Ryan Blaney | 4 | 15.8 | 11 | 21.5 | 0 | 0 | 0 | 1 | 3 | 30 |
| Clint Bowyer | 4 | 17 | 22 | 24.5 | 0 | 0 | 0 | 1 | 2 | 10 |
| Matt DiBenedetto | 4 | 31.5 | 24.3 | 23.8 | 0 | 0 | 0 | 0 | 2 | 18 |
| Brendan Gaughan | 3 | 32.3 | 26 | 22.3 | 0 | 0 | 0 | 0 | 1 | 7 |
| Bubba Wallace | 1 | 15 | 14 | 16 | 0 | 0 | 0 | 0 | 1 | 5 |
| DJ Kennington | 2 | 35.5 | 30.5 | 26.5 | 0 | 0 | 0 | 0 | 1 | 0 |
| Michael McDowell | 4 | 26.8 | 19.8 | 28 | 0 | 0 | 0 | 0 | 1 | 0 |
| William Byron | 1 | 17 | 13 | 29 | 0 | 0 | 0 | 0 | 0 | 14 |
| Martin Truex Jr | 4 | 9.5 | 20.8 | 31 | 0 | 0 | 0 | 0 | 0 | 2 |
| Cody Ware | 0 | 0 | 0 | 0 | 0 | 0 | 0 | 0 | 0 | 0 |
| JJ Yeley | 0 | 0 | 0 | 0 | 0 | 0 | 0 | 0 | 0 | 0 |
| Regan Smith | 1 | 29 | 24 | 25 | 0 | 0 | 0 | 0 | 0 | 0 |
| Ross Chastain | 1 | 35 | 33 | 25 | 0 | 0 | 0 | 0 | 0 | 0 |
| Landon Cassill | 3 | 28.7 | 23.3 | 26 | 0 | 0 | 0 | 0 | 0 | 0 |
| Joey Gase | 3 | 36.7 | 29.3 | 26.7 | 0 | 0 | 0 | 0 | 0 | 0 |
| Corey LaJoie | 1 | 36 | 38 | 27 | 0 | 0 | 0 | 0 | 0 | 0 |
| Jeffrey Earnhardt | 3 | 37.7 | 34 | 33.3 | 0 | 0 | 0 | 0 | 0 | 0 |
| Erik Jones | 3 | 14.3 | 26 | 36 | 0 | 0 | 0 | 0 | 0 | 0 |
| Fast | Top 15 | Laps | Avg. | High | Low | Pos | Laps Led | High to | Low to | |
| Driver | Laps | Rate | Comp. | Rating | Rating | Rating | Diff | Pts./Race | Avg Rating | Avg Rating |
| Joey Logano | 13 | 82% | 736 | 110.8 | 132 | 96.7 | 0.50 | 11.50 | 21.2 | 14.1 |
| Ricky Stenhouse Jr | 21 | 62% | 742 | 91.4 | 98.8 | 83.4 | -4.50 | 1.88 | 7.4 | 8 |
| Brad Keselowski | 15 | 72% | 688 | 95.5 | 109.8 | 85.6 | -14.50 | 9.31 | 14.3 | 9.9 |
| Aric Almirola | 6 | 41% | 759 | 75.4 | 81.2 | 62.4 | 22.50 | 0.00 | 5.8 | 13 |
| Kurt Busch | 23 | 72% | 742 | 94.7 | 110.8 | 79.1 | -2.30 | 0.50 | 16.1 | 15.6 |
| Denny Hamlin | 12 | 73% | 759 | 94.1 | 108.1 | 86.8 | 1.00 | 4.38 | 14 | 7.3 |
| Ryan Newman | 18 | 20% | 753 | 62.6 | 72.6 | 50.5 | 8.80 | 0.31 | 10 | 12.1 |
| Kevin Harvick | 15 | 57% | 747 | 87.3 | 104.4 | 68.8 | -0.70 | 1.69 | 17.1 | 18.5 |
| Chase Elliott | 8 | 76% | 730 | 91.8 | 99.6 | 80 | -10.50 | 2.19 | 7.8 | 11.8 |
| Kyle Busch | 17 | 58% | 742 | 86.5 | 112.2 | 55.8 | -3.50 | 3.38 | 25.7 | 30.7 |
| Trevor Bayne | 18 | 40% | 619 | 66.7 | 85 | 33.7 | -12.00 | 0.31 | 18.3 | 33 |
| Jamie McMurray | 10 | 40% | 582 | 64.1 | 89 | 37.2 | 1.00 | 0.00 | 24.9 | 26.9 |
| David Ragan | 22 | 29% | 759 | 69.8 | 88.1 | 47.7 | 16.00 | 0.00 | 18.3 | 22.1 |
| Paul Menard | 21 | 59% | 736 | 82.7 | 92.8 | 70.4 | -3.00 | 0.56 | 10.1 | 12.3 |
| Kyle Larson | 13 | 53% | 641 | 81.1 | 96.8 | 69.6 | 2.00 | 0.00 | 15.7 | 11.5 |
| Daniel Suarez | 14 | 49% | 563 | 70.8 | 78 | 58.4 | -3.00 | 1.00 | 7.2 | 12.4 |
| Jimmie Johnson | 9 | 73% | 742 | 91.2 | 101.8 | 70.2 | 1.00 | 0.19 | 10.6 | 21 |
| Gray Gaulding | 14 | 6% | 566 | 49.1 | 61.2 | 41.8 | 20.00 | 0.00 | 12.1 | 7.3 |
| Alex Bowman | 11 | 62% | 379 | 84 | 96.8 | 71.2 | -7.00 | 3.25 | 12.8 | 12.8 |
| AJ Allmendinger | 19 | 16% | 697 | 53.8 | 55.3 | 51.9 | 3.50 | 0.19 | 1.5 | 1.9 |
| Austin Dillon | 19 | 24% | 696 | 65.5 | 82.4 | 55.9 | -10.00 | 0.06 | 16.9 | 9.6 |
| Ty Dillon | 14 | 31% | 567 | 68.5 | 74.8 | 61.4 | 14.30 | 0.25 | 6.3 | 7.1 |
| Chris Buescher | 11 | 24% | 753 | 60.4 | 70.3 | 52.4 | 13.70 | 0.06 | 9.9 | 8 |
| Ryan Blaney | 15 | 75% | 717 | 92.1 | 98.3 | 87.2 | -5.70 | 1.88 | 6.2 | 4.9 |
| Clint Bowyer | 29 | 34% | 703 | 66.4 | 79.4 | 51.9 | -7.50 | 0.63 | 13 | 14.5 |
| Matt DiBenedetto | 10 | 11% | 742 | 53 | 61.7 | 42.2 | 7.70 | 1.13 | 8.7 | 10.8 |
| Brendan Gaughan | 14 | 15% | 548 | 53.8 | 69.3 | 35.6 | 10.00 | 0.58 | 15.5 | 18.2 |
| Bubba Wallace | 2 | 52% | 188 | 79 | 79 | 79 | -1.00 | 1.25 | 0 | 0 |
| DJ Kennington | 7 | 2% | 352 | 43.5 | 47 | 39.9 | 9.00 | 0.00 | 3.5 | 3.6 |
| Michael McDowell | 15 | 34% | 696 | 66.6 | 74.3 | 59 | -1.20 | 0.00 | 7.7 | 7.6 |
| William Byron | 4 | 67% | 165 | 85.8 | 85.8 | 85.8 | -12.00 | 3.50 | 0 | 0 |
| Martin Truex Jr | 9 | 45% | 564 | 73.7 | 94.3 | 49.5 | -21.50 | 0.13 | 20.6 | 24.2 |
| Cody Ware | 0 | 0% | 0 | 0 | 0 | 0 | 0.00 | 0 | 0 | |
| JJ Yeley | 0 | 0% | 0 | 0 | 0 | 0 | 0.00 | 0 | 0 | |
| Regan Smith | 3 | 0% | 192 | 60.5 | 60.5 | 60.5 | 4.00 | 0.00 | 0 | 0 |
| Ross Chastain | 2 | 0% | 186 | 36.7 | 36.7 | 36.7 | 10.00 | 0.00 | 0 | 0 |
| Landon Cassill | 11 | 13% | 536 | 63.6 | 67.8 | 57.6 | 2.70 | 0.00 | ||
| Joey Gase | 8 | 4% | 533 | 42.2 | 47.5 | 38.4 | 10.00 | 0.00 | 5.3 | 3.8 |
| Corey LaJoie | 1 | 0% | 183 | 33.4 | 33.4 | 33.4 | 9.00 | 0.00 | 0 | 0 |
| Jeffrey Earnhardt | 7 | 1% | 391 | 35.6 | 44.1 | 29.5 | 4.40 | 0.00 | 8.5 | 6.1 |
| Erik Jones | 2 | 24% | 265 | 49.7 | 77.8 | 34.7 | -21.70 | 0.00 | 28.1 | 15 |
Top-15 Drivers at Last 10 Races at Talladega
| Avg. | Avg. | Avg. | Top | Top | Top | Top | Laps | |||
| Driver | Races | Start | Run Pos. | Finish | Wins | 5s | 10s | 15s | 20s | Led |
| Brad Keselowski | 10 | 8.5 | 15.3 | 17.4 | 3 | 4 | 5 | 5 | 5 | 208 |
| Joey Logano | 10 | 16.7 | 12.8 | 15.6 | 3 | 4 | 4 | 5 | 6 | 242 |
| Ricky Stenhouse Jr | 9 | 13 | 16.3 | 11.2 | 1 | 4 | 6 | 6 | 7 | 39 |
| Jamie McMurray | 10 | 24.3 | 20.7 | 20.5 | 1 | 3 | 3 | 4 | 5 | 19 |
| Denny Hamlin | 10 | 15.8 | 14.8 | 16.8 | 1 | 2 | 4 | 6 | 7 | 98 |
| Kyle Busch | 9 | 19.9 | 17.4 | 15.9 | 0 | 3 | 3 | 6 | 6 | 87 |
| Kurt Busch | 10 | 13.6 | 12.5 | 12.5 | 0 | 2 | 6 | 7 | 8 | 13 |
| Ryan Newman | 10 | 17 | 25.8 | 12.9 | 0 | 2 | 5 | 7 | 8 | 18 |
| Paul Menard | 10 | 13.8 | 14.9 | 14.5 | 0 | 2 | 5 | 7 | 7 | 21 |
| Clint Bowyer | 10 | 22.1 | 22.8 | 15.9 | 0 | 2 | 5 | 6 | 7 | 14 |
| Aric Almirola | 10 | 22.3 | 20.5 | 15.6 | 0 | 2 | 4 | 6 | 7 | 9 |
| Chase Elliott | 5 | 4 | 10.6 | 13.2 | 0 | 2 | 2 | 3 | 4 | 62 |
| Kevin Harvick | 10 | 19.1 | 14.1 | 12 | 0 | 1 | 5 | 8 | 9 | 58 |
| Martin Truex Jr | 10 | 18.8 | 17.1 | 20.1 | 0 | 1 | 3 | 4 | 5 | 3 |
| Austin Dillon | 10 | 16.2 | 20.2 | 21.5 | 0 | 1 | 2 | 5 | 5 | 1 |
| Fast | Top 15 | Laps | Avg. | High | Low | Pos. | Laps Led | Rating | |
| Driver | Laps | Rate | Comp. | Rating | Rating | Rating | Diff. | Pts/Race | Range |
| Brad Keselowski | 33 | 64% | 1801 | 91.7 | 125.2 | 32.6 | -8.90 | 5.20 | 92.6 |
| Joey Logano | 33 | 69% | 1854 | 96.2 | 132 | 44.3 | 1.10 | 6.05 | 87.7 |
| Ricky Stenhouse Jr | 46 | 50% | 1690 | 82.1 | 105.5 | 46.9 | 1.80 | 1.08 | 58.6 |
| Jamie McMurray | 30 | 46% | 1704 | 72.9 | 115.2 | 32.4 | 3.80 | 0.48 | 82.8 |
| Denny Hamlin | 34 | 60% | 1833 | 89.4 | 123.2 | 63.2 | -1.00 | 2.45 | 60 |
| Kyle Busch | 34 | 57% | 1647 | 84.6 | 112.2 | 31.1 | 4.00 | 2.42 | 81.1 |
| Kurt Busch | 32 | 71% | 1870 | 93.4 | 110.8 | 79.1 | 1.10 | 0.33 | 31.7 |
| Ryan Newman | 48 | 14% | 1885 | 60.4 | 76.8 | 45.8 | 4.10 | 0.45 | 31 |
| Paul Menard | 55 | 57% | 1864 | 83.1 | 98.9 | 53.2 | -0.70 | 0.53 | 45.7 |
| Clint Bowyer | 68 | 33% | 1845 | 71.6 | 88.5 | 51.9 | 6.20 | 0.35 | 36.6 |
| Aric Almirola | 27 | 34% | 1865 | 70.7 | 81.7 | 56.3 | 6.70 | 0.23 | 25.4 |
| Chase Elliott | 11 | 75% | 918 | 93.7 | 101.3 | 80 | -9.20 | 3.10 | 21.3 |
| Kevin Harvick | 36 | 60% | 1889 | 90.2 | 107.6 | 65.6 | 7.10 | 1.45 | 42 |
| Martin Truex Jr | 19 | 57% | 1706 | 80.7 | 99.1 | 49.5 | -1.30 | 0.08 | 49.6 |
| Austin Dillon | 46 | 34% | 1806 | 70.5 | 83.1 | 53.8 | -5.30 | 0.03 | 29.3 |
Top-15 Drivers at Last 20 Similar Races (Talladega and Daytona)
| Avg. | Avg. | Avg. | Top | Top | Top | Top | Laps | |||
| Driver | Races | Start | Run Pos. | Finish | Wins | 5s | 10s | 15s | 20s | Led |
| Joey Logano | 20 | 16.1 | 14.2 | 15.1 | 4 | 7 | 9 | 11 | 13 | 300 |
| Brad Keselowski | 20 | 14.5 | 16.2 | 20.6 | 4 | 6 | 7 | 7 | 9 | 383 |
| Denny Hamlin | 20 | 16.9 | 14 | 14.2 | 2 | 7 | 10 | 12 | 15 | 268 |
| Ricky Stenhouse Jr | 19 | 15.6 | 17.7 | 15.9 | 2 | 6 | 9 | 9 | 12 | 118 |
| Kurt Busch | 19 | 15.1 | 13.3 | 14.7 | 1 | 5 | 10 | 11 | 12 | 81 |
| Aric Almirola | 19 | 23.4 | 20 | 16.5 | 1 | 4 | 6 | 12 | 13 | 31 |
| Austin Dillon | 20 | 14.9 | 18.8 | 16.6 | 1 | 3 | 9 | 13 | 14 | 19 |
| Jamie McMurray | 20 | 20.9 | 19.1 | 21.5 | 1 | 3 | 3 | 7 | 10 | 43 |
| Erik Jones | 7 | 18.7 | 24.3 | 27.6 | 1 | 1 | 2 | 2 | 2 | 21 |
| Kyle Busch | 18 | 18.8 | 18.3 | 18.2 | 0 | 5 | 5 | 8 | 11 | 160 |
| Kevin Harvick | 20 | 16.9 | 16.4 | 16.3 | 0 | 4 | 8 | 12 | 14 | 127 |
| Paul Menard | 20 | 18.1 | 16.1 | 16.5 | 0 | 4 | 8 | 10 | 13 | 51 |
| Jimmie Johnson | 20 | 13.9 | 13.3 | 19.1 | 0 | 4 | 5 | 8 | 10 | 348 |
| Clint Bowyer | 20 | 19.3 | 21.8 | 17 | 0 | 3 | 10 | 12 | 13 | 23 |
| Ryan Newman | 20 | 18.3 | 24.1 | 14.6 | 0 | 3 | 9 | 12 | 14 | 21 |
| Fast | Top 15 | Laps | Avg. | High | Low | Pos | Laps Led | Rating | |
| Driver | Laps | Rate | Comp. | Rating | Rating | Rating | Diff. | Pts./Race | Range |
| Joey Logano | 83 | 66% | 3422 | 93 | 132 | 44.3 | 1.00 | 3.75 | 87.7 |
| Brad Keselowski | 58 | 58% | 3203 | 87.3 | 132.4 | 32.6 | -6.10 | 4.79 | 99.8 |
| Denny Hamlin | 58 | 65% | 3486 | 91.2 | 139.1 | 49.5 | 2.70 | 3.35 | 89.6 |
| Ricky Stenhouse Jr | 86 | 44% | 3312 | 79.3 | 111.5 | 34.1 | -0.30 | 1.55 | 77.4 |
| Kurt Busch | 67 | 67% | 3307 | 90.6 | 120.8 | 45.5 | 0.40 | 1.07 | 75.3 |
| Aric Almirola | 68 | 36% | 3385 | 72.7 | 111.4 | 56.3 | 6.90 | 0.41 | 55.1 |
| Austin Dillon | 90 | 43% | 3487 | 74.9 | 97.1 | 43.1 | -1.70 | 0.24 | 54 |
| Jamie McMurray | 62 | 49% | 3233 | 75 | 115.2 | 32.4 | -0.60 | 0.54 | 82.8 |
| Erik Jones | 20 | 27% | 758 | 63.5 | 84.6 | 34.7 | -8.90 | 0.75 | 49.9 |
| Kyle Busch | 62 | 51% | 2996 | 81.1 | 117.2 | 31.1 | 0.60 | 2.22 | 86.1 |
| Kevin Harvick | 65 | 54% | 3357 | 86.9 | 116.3 | 32 | 0.60 | 1.59 | 84.3 |
| Paul Menard | 93 | 54% | 3535 | 81 | 98.9 | 53.2 | 1.60 | 0.64 | 45.7 |
| Jimmie Johnson | 57 | 68% | 3262 | 91.2 | 119.2 | 48.3 | -5.20 | 4.35 | 70.9 |
| Clint Bowyer | 103 | 35% | 3467 | 71 | 104 | 41 | 2.30 | 0.29 | 63 |
| Ryan Newman | 94 | 21% | 3626 | 61.8 | 90.9 | 43.2 | 3.70 | 0.26 | 47.7 |
Momentum
| Avg. | Avg. | Avg. | Top | Top | Top | Top | Pos | Avg. | |||
| Driver | Races | Start | Run Pos. | Finish | Wins | 5s | 10s | 15s | 20s | Diff. | Rating |
| Brad Keselowski | 5 | 11 | 8 | 11.2 | 2 | 2 | 3 | 4 | 4 | -0.2 | 107.3 |
| Chase Elliott | 5 | 9.8 | 9.2 | 12.4 | 1 | 2 | 3 | 4 | 4 | -2.6 | 101.1 |
| Ryan Blaney | 5 | 7.2 | 11.4 | 9.4 | 1 | 2 | 2 | 4 | 5 | -2.2 | 91.5 |
| Kyle Busch | 5 | 6.2 | 9.4 | 11.2 | 1 | 1 | 4 | 4 | 4 | -5 | 100.3 |
| Kevin Harvick | 5 | 5.8 | 9 | 12 | 0 | 2 | 4 | 4 | 4 | -6.2 | 112.7 |
| Joey Logano | 5 | 8 | 9.8 | 8.8 | 0 | 2 | 3 | 5 | 5 | -0.8 | 96.7 |
| Kurt Busch | 5 | 5 | 8.2 | 11 | 0 | 2 | 3 | 3 | 4 | -6 | 101.1 |
| Clint Bowyer | 5 | 11.8 | 10 | 15.2 | 0 | 2 | 3 | 3 | 3 | -3.4 | 97.7 |
| Martin Truex Jr | 5 | 6.4 | 11.6 | 15 | 0 | 2 | 2 | 4 | 4 | -8.6 | 100.6 |
| Denny Hamlin | 5 | 11.4 | 12.4 | 13 | 0 | 2 | 2 | 3 | 4 | -1.6 | 90.2 |
| Erik Jones | 5 | 10 | 16.6 | 17.4 | 0 | 2 | 2 | 3 | 3 | -7.4 | 81.3 |
| Kyle Larson | 5 | 8.4 | 9 | 12 | 0 | 1 | 2 | 4 | 4 | -3.6 | 103.1 |
| Aric Almirola | 5 | 13 | 12.4 | 13.2 | 0 | 1 | 2 | 3 | 4 | -0.2 | 90.2 |
| Jamie McMurray | 5 | 15 | 15.4 | 16.6 | 0 | 1 | 2 | 2 | 3 | -1.6 | 80.2 |
| Alex Bowman | 5 | 10.4 | 15.6 | 19.2 | 0 | 1 | 1 | 2 | 3 | -8.8 | 77.3 |
Price Changes Since April Talladega Race
DraftKings
| 1000 Bulbs | Geico 500 | ||
| Driver | 500 Salary | Salary | Difference |
| AJ Allmendinger | 6200 | 5900 | 300 |
| Alex Bowman | 8600 | 7600 | 1000 |
| Aric Almirola | 8800 | 8100 | 700 |
| Austin Dillon | 7600 | 8000 | -400 |
| Brad Keselowski | 11100 | 10700 | 400 |
| Brendan Gaughan | 5500 | 4900 | 600 |
| Bubba Wallace | 6900 | 6500 | 400 |
| Chase Elliott | 10300 | 10100 | 200 |
| Chris Buescher | 6400 | 6100 | 300 |
| Clint Bowyer | 9200 | 8400 | 800 |
| D.J. Kennington | 4800 | 4700 | 100 |
| Daniel Suarez | 7400 | 7000 | 400 |
| David Ragan | 5700 | 6300 | -600 |
| Denny Hamlin | 10000 | 10500 | -500 |
| Erik Jones | 8300 | 8200 | 100 |
| Gray Gaulding | 4400 | 5100 | -700 |
| Jamie McMurray | 7200 | 7800 | -600 |
| Jimmie Johnson | 8200 | 8800 | -600 |
| Joey Gase | 4600 | 4600 | 0 |
| Joey Logano | 10700 | 10300 | 400 |
| Kevin Harvick | 10100 | 9800 | 300 |
| Kurt Busch | 9800 | 8600 | 1200 |
| Kyle Busch | 9400 | 9600 | -200 |
| Kyle Larson | 8000 | 9300 | -1300 |
| Martin Truex Jr | 8400 | 9500 | -1100 |
| Matt DiBenedetto | 5400 | 5200 | 200 |
| Michael McDowell | 5800 | 5700 | 100 |
| Paul Menard | 7800 | 7200 | 600 |
| Ricky Stenhouse Jr | 9000 | 9100 | -100 |
| Ross Chastain | 5200 | 5000 | 200 |
| Ryan Blaney | 9600 | 9000 | 600 |
| Ryan Newman | 7100 | 6900 | 200 |
| Trevor Bayne | 6600 | 6800 | -200 |
| Ty Dillon | 6000 | 6700 | -700 |
| William Byron | 6800 | 7400 | -600 |
FanDuel
| 1000 Bulbs | Geico 500 | ||
| Driver | 500 Salary | Salary | Difference |
| AJ Allmendinger | 6800 | 6600 | 200 |
| Alex Bowman | 9200 | 7800 | 1400 |
| Aric Almirola | 9900 | 8800 | 1100 |
| Austin Dillon | 8400 | 9300 | -900 |
| Brad Keselowski | 13000 | 12100 | 900 |
| Brendan Gaughan | 4000 | 5000 | -1000 |
| Bubba Wallace | 7000 | 6300 | 700 |
| Chase Elliott | 11800 | 10600 | 1200 |
| Chris Buescher | 7500 | 5600 | 1900 |
| Clint Bowyer | 10700 | 11400 | -700 |
| D.J. Kennington | 4000 | 5000 | -1000 |
| Daniel Suarez | 7900 | 7200 | 700 |
| David Ragan | 5000 | 8100 | -3100 |
| Denny Hamlin | 11600 | 11800 | -200 |
| Erik Jones | 9000 | 7600 | 1400 |
| Jamie McMurray | 7600 | 10100 | -2500 |
| Jimmie Johnson | 9500 | 11200 | -1700 |
| Joey Gase | 4000 | 5000 | -1000 |
| Joey Logano | 12500 | 12000 | 500 |
| Kevin Harvick | 12200 | 12300 | -100 |
| Kurt Busch | 11400 | 10400 | 1000 |
| Kyle Busch | 10300 | 11600 | -1300 |
| Kyle Larson | 8200 | 9800 | -1600 |
| Martin Truex Jr. | 10100 | 11000 | -900 |
| Matt DiBenedetto | 4500 | 5000 | -500 |
| Michael McDowell | 5500 | 5300 | 200 |
| Paul Menard | 8800 | 9100 | -300 |
| Ricky Stenhouse Jr. | 9700 | 10800 | -1100 |
| Ross Chastain | 4000 | 5000 | -1000 |
| Ryan Blaney | 11000 | 10200 | 800 |
| Ryan Newman | 8600 | 9500 | -900 |
| Trevor Bayne | 7400 | 7000 | 400 |
| Ty Dillon | 6500 | 5800 | 700 |
| William Byron | 7200 | 7500 | -300 |
Points Changes at Talladega October Race
DraftKings
| 17 Race | Season | DK Pts +/- | |
| Driver | Total | Avg DK Pts. | Season AVG |
| Gray Gaulding | 69 | 15.24 | 53.8 |
| Ryan Newman | 69.75 | 26.62 | 43.1 |
| David Ragan | 59.5 | 23.08 | 36.4 |
| Trevor Bayne | 49.5 | 20.39 | 29.1 |
| Ty Dillon | 50 | 22.26 | 27.7 |
| Aric Almirola | 61 | 38.89 | 22.1 |
| Joey Logano | 56.75 | 38.34 | 18.4 |
| Brad Keselowski | 54.75 | 36.64 | 18.1 |
| Paul Menard | 43.5 | 26.23 | 17.3 |
| Brendan Gaughan | 44.5 | 30.19 | 14.3 |
| Chris Buescher | 39 | 25.34 | 13.7 |
| Denny Hamlin | 49 | 37.37 | 11.6 |
| AJ Allmendinger | 25.25 | 24.28 | 1.0 |
| Daniel Suarez | 31.75 | 31.36 | 0.4 |
| Landon Cassill | 19 | 19.25 | -0.3 |
| Matt DiBenedetto | 18.5 | 20.93 | -2.4 |
| Joey Gase | 17.5 | 20.75 | -3.3 |
| Michael McDowell | 17.5 | 22.56 | -5.1 |
| Kyle Larson | 35 | 40.98 | -6.0 |
| DJ Kennington | 20.5 | 28.19 | -7.7 |
| Ryan Blaney | 24.25 | 35.78 | -11.5 |
| Jeffrey Earnhardt | 2 | 18.14 | -16.1 |
| Chase Elliott | 22 | 38.18 | -16.2 |
| Austin Dillon | 7.5 | 28.61 | -21.1 |
| Ricky Stenhouse Jr | -0.5 | 24.67 | -25.2 |
| Jimmie Johnson | 4.5 | 30.63 | -26.1 |
| Martin Truex Jr | 20.5 | 48.58 | -28.1 |
| Erik Jones | -5 | 30.69 | -35.7 |
| Jamie McMurray | -13 | 23.16 | -36.2 |
| Kurt Busch | 2.25 | 39.41 | -37.2 |
| Kevin Harvick | 27.5 | 67.18 | -39.7 |
| Kyle Busch | 7.5 | 61.78 | -54.3 |
| Clint Bowyer | -15.5 | 43.16 | -58.7 |
| AVG. +/- | 22.4 |
FanDuel
| 17 Race | 18 Season | FD Pts +/- | |
| Driver | Total | Avg FD Pts. | Season AVG |
| Ryan Newman | 71.6 | 48.21 | 23.39 |
| Trevor Bayne | 60.3 | 42.51 | 17.79 |
| David Ragan | 61.3 | 45.05 | 16.25 |
| Ty Dillon | 55.8 | 43.04 | 12.76 |
| Brad Keselowski | 64 | 51.82 | 12.18 |
| Aric Almirola | 65.3 | 54.23 | 11.07 |
| Brendan Gaughan | 48.3 | 39.58 | 8.72 |
| Paul Menard | 51.8 | 45.41 | 6.39 |
| Denny Hamlin | 58.7 | 54.61 | 4.09 |
| Joey Logano | 61.2 | 57.15 | 4.05 |
| Chris Buescher | 47.7 | 45.28 | 2.42 |
| Daniel Suarez | 45 | 49.18 | -4.18 |
| Joey Gase | 27.9 | 33.40 | -5.50 |
| AJ Allmendinger | 37.3 | 42.97 | -5.67 |
| Landon Cassill | 31.1 | 38.62 | -7.52 |
| Kyle Larson | 46.3 | 55.87 | -9.57 |
| Ryan Blaney | 38.9 | 51.32 | -12.42 |
| Matt DiBenedetto | 28.8 | 41.22 | -12.42 |
| Michael McDowell | 27.6 | 40.06 | -12.46 |
| Chase Elliott | 38.8 | 54.46 | -15.66 |
| DJ Kennington | 27.9 | 46.44 | -18.54 |
| Martin Truex Jr | 34.1 | 56.79 | -22.69 |
| Jimmie Johnson | 26.1 | 48.79 | -22.69 |
| Ricky Stenhouse Jr | 22.2 | 45.41 | -23.21 |
| Kevin Harvick | 39.6 | 63.25 | -23.65 |
| Austin Dillon | 23.6 | 49.23 | -25.63 |
| Kurt Busch | 22.9 | 55.04 | -32.14 |
| Jeffrey Earnhardt | 3.5 | 37.39 | -33.89 |
| Kyle Busch | 26 | 62.89 | -36.89 |
| Clint Bowyer | 7.5 | 56.32 | -48.82 |
| Jamie McMurray | -3.5 | 46.13 | -49.63 |
| Erik Jones | 1.1 | 51.26 | -50.16 |
| AVG. +/- | 18.51 |
Top-10 and Bottom-10 Value Drivers
DraftKings
| Rank | Driver | Value | Rank | Driver | Value |
|---|---|---|---|---|---|
| 1 | Kevin Harvick | 6.65 | 41 | Cody Ware | 2.11 |
| 2 | Kyle Busch | 6.57 | 40 | Ricky Stenhouse Jr | 2.74 |
| 3 | D.J. Kennington | 5.87 | 39 | Bubba Wallace | 3.04 |
| 4 | Martin Truex Jr | 5.78 | 38 | Trevor Bayne | 3.09 |
| 5 | Brendan Gaughan | 5.49 | 37 | Jamie McMurray | 3.22 |
| 6 | Kyle Larson | 5.12 | 36 | Alex Bowman | 3.28 |
| 7 | Regan Smith | 5.08 | 35 | Brad Keselowski | 3.30 |
| 8 | Clint Bowyer | 4.69 | 34 | William Byron | 3.32 |
| 9 | Joey Gase | 4.51 | 33 | Corey Lajoie | 3.34 |
| 10 | Aric Almirola | 4.42 | 32 | Paul Menard | 3.36 |
FanDuel
| Rank | Driver | Value | Rank | Driver | Value |
|---|---|---|---|---|---|
| 1 | D.J. Kennington | 11.61 | 39 | Brad Keselowski | 3.99 |
| 2 | Ross Chastain | 10.00 | 38 | Joey Logano | 4.57 |
| 3 | J.J. Yeley | 9.91 | 37 | Chase Elliott | 4.62 |
| 4 | Brendan Gaughan | 9.89 | 36 | Ryan Blaney | 4.67 |
| 5 | Landon Cassill | 9.65 | 35 | Ricky Stenhouse Jr. | 4.68 |
| 6 | Jeffrey Earnhardt | 9.35 | 34 | Denny Hamlin | 4.71 |
| 7 | Matt DiBenedetto | 9.16 | 33 | Kurt Busch | 4.83 |
| 8 | David Ragan | 9.01 | 32 | Jimmie Johnson | 5.14 |
| 9 | Regan Smith | 8.84 | 31 | Paul Menard | 5.16 |
| 10 | Joey Gase | 8.35 | 30 | Kevin Harvick | 5.18 |
Drivers To Watch This Week
Brad Keselowski: Brad is the most-expensive guy on both sites and for good reason. He has been dominant on restrictor plate tracks in not only the last few years but his career in general. A win, two top-10s and 149 laps led here in the last four races is pretty solid but in the last 10 trips to the Alabama speedway Keselowski has three wins, four top-fives, and five top-10s with 208 laps run out front. He is arguably the best plate racer in the field and is on a team that specialize at these tracks in Team Penske.
Joey Logano: Logano has actually outperformed his teammate here in the last four and last 10 races with two wins and three top-fives and 184 laps led in the last four races and three wins, four top-fives, four top-10s and 242 laps led in the last 10. Logano is also the only driver with a driver rating better than 100 in the last four races. Combined the two Penske teammates have won six of the last eight races at Dega. They aren’t too shabby at Daytona either. Both are looking to lock their way into the Round of 8 but might be the calmest drivers at an anxiety inducing track.
Ricky Stenhouse Jr.: Stenhouse is the only driver of the the five talked about here that isn’t a playoff driver anymore, but that doesn’t take away his skills at these type of tracks. In the last four races at Dega, the driver of the 17-car has a win, three top-fives, and 30 laps led. He gets a lot of crap through out the year for causing a bunch of wrecks at other tracks, but ironically put him in a majorly accident-prone track and he seems to avoid them pretty handily. If he gets a win he doesn’t advance but it still doesn’t dampen his effectiveness for DFS plays.
Aric Almirola: Almirola happens to be the only driver in the field with four straight top-10s at Talladega. He hasn’t gotten a win in that span but does also have two top-fives. A track known for its wild position changes, Almirola’s +22.5 mark in the last four is the best in the field as well. All of this and I haven’t mentioned that he was leading the Daytona 500 with two laps to go until he got spun by Austin Dillon when Almirola blocked him. He is surprisingly only $8,800 on DK and $9,900 on FD which are very good values given his history.
Kurt Busch: Busch won last year’s Daytona 500 to start things off but at Talladega he’s been pretty good too with two top-fives and three top-10s in the last four races here. His 9.3 average finish mark is tied for third-best in the field behind Almirola’s 6.0, Hamlin’s 8.5 and even with Stenhouse. Busch doesn’t have a win here in the last 10 but the six top-10s are tied (again with Stenhouse) for the best in the field in that span and once more his average finish of 12.5 is only bested by Kevin Harvick at 12.0. Consistency matters here and Busch has it in spades.