
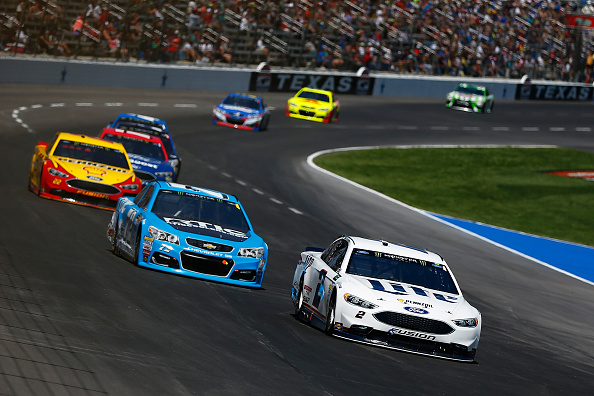

The second race in the Round of 8 is this Sunday at Texas Motor Speedway, the penultimate 1.5-mile track on the schedule. With Kyle Busch locked into the championship and Martin Truex Jr. ahead by such a wide margin, that leaves only two spots likely up for grabs at Homestead-Miami. Texas performs like most tracks of it’s distance meaning, most races have several different drivers lead a lot of laps as opposed to one driver dominating in the category. That’s not to say it’s not out of the question to have a single driver lead more than half the laps, it’s just not as common here.
The track is typical Tri-Oval design, with one exception. The banking in turns 1 and 2 are different than that in turns 3 and 4. It’s 20 degrees in the first two corners and 24 in the second pair, meaning it’s easier to hold speed through the backstretch, turns 3 and 4 and the Tri-Oval.
Track Data
| Avg. | Avg. | Laps | High | Low | Avg. | Difference | Laps Led | Laps Led | ||||||||
| Driver | Start | Finish | Races | Wins | Top 5s | Top 10s | Top 20s | Led | Poles | Finish | Finish | DNF | Rating | Pts. | Pts. | Pts./race |
| Jimmie Johnson | 13.4 | 3.6 | 5 | 3 | 4 | 4 | 5 | 152 | 0 | 1 | 11 | 0 | 114 | 9.8 | 38 | 7.60 |
| Kyle Busch | 19 | 6.25 | 4 | 1 | 3 | 3 | 4 | 37 | 0 | 1 | 15 | 0 | 102.4 | 12.75 | 9.25 | 2.31 |
| Joey Logano | 3.6 | 10.4 | 5 | 0 | 4 | 4 | 4 | 235 | 0 | 2 | 40 | 0 | 101.4 | -6.8 | 58.75 | 11.75 |
| Kevin Harvick | 6 | 5 | 5 | 0 | 3 | 5 | 5 | 185 | 1 | 2 | 10 | 0 | 116.6 | 1 | 46.25 | 9.25 |
| Dale Earnhardt Jr. | 22 | 4 | 4 | 0 | 3 | 4 | 4 | 0 | 0 | 2 | 6 | 0 | 106.1 | 18 | 0 | 0.00 |
| Brad Keselowski | 4.2 | 9 | 5 | 0 | 2 | 3 | 5 | 343 | 1 | 2 | 18 | 0 | 108.4 | -4.8 | 85.75 | 17.15 |
| Chase Elliott | 16 | 6 | 3 | 0 | 2 | 3 | 3 | 4 | 0 | 4 | 9 | 0 | 98.3 | 10 | 1 | 0.33 |
| Martin Truex Jr. | 12 | 6.8 | 5 | 0 | 1 | 5 | 5 | 257 | 0 | 3 | 9 | 0 | 117.9 | 5.2 | 64.25 | 12.85 |
| Kyle Larson | 14.2 | 18.6 | 5 | 0 | 1 | 1 | 3 | 0 | 0 | 2 | 37 | 1 | 88.8 | -4.4 | 0 | 0.00 |
| Kurt Busch | 9.8 | 12 | 5 | 0 | 0 | 3 | 5 | 45 | 1 | 7 | 20 | 0 | 89.4 | -2.2 | 11.25 | 2.25 |
| Jamie McMurray | 15.2 | 11 | 5 | 0 | 0 | 3 | 5 | 9 | 0 | 6 | 19 | 0 | 87.3 | 4.2 | 2.25 | 0.45 |
| Kasey Kahne | 20.6 | 16.4 | 5 | 0 | 0 | 3 | 4 | 6 | 0 | 8 | 38 | 0 | 85.4 | 4.2 | 1.5 | 0.30 |
| Matt Kenseth | 10.3 | 14.25 | 4 | 0 | 0 | 1 | 3 | 20 | 0 | 7 | 23 | 0 | 91.8 | -3.95 | 5 | 1.25 |
| Denny Hamlin | 13.4 | 19 | 5 | 0 | 0 | 1 | 3 | 1 | 0 | 9 | 38 | 0 | 72 | -5.6 | 0.25 | 0.05 |
| Ryan Newman | 14.4 | 17.4 | 5 | 0 | 0 | 1 | 3 | 0 | 0 | 10 | 26 | 0 | 72.3 | -3 | 0 | 0.00 |
| Ricky Stenhouse Jr. | 17.2 | 16.4 | 5 | 0 | 0 | 0 | 4 | 0 | 0 | 14 | 21 | 0 | 75.8 | 0.8 | 0 | 0.00 |
| Trevor Bayne | 20.4 | 23 | 5 | 0 | 0 | 0 | 3 | 12 | 0 | 13 | 39 | 0 | 62.1 | -2.6 | 3 | 0.60 |
| Austin Dillon | 15.2 | 24 | 5 | 0 | 0 | 0 | 3 | 6 | 1 | 11 | 37 | 1 | 71.1 | -8.8 | 1.5 | 0.30 |
| A.J. Allmendinger | 21.8 | 19.4 | 5 | 0 | 0 | 0 | 3 | 0 | 0 | 17 | 22 | 0 | 66.1 | 2.4 | 0 | 0.00 |
| Aric Almirola | 23.8 | 20.2 | 5 | 0 | 0 | 0 | 3 | 0 | 0 | 18 | 24 | 0 | 63.5 | 3.6 | 0 | 0.00 |
| Ryan Blaney | 11 | 27.6 | 5 | 0 | 0 | 0 | 2 | 148 | 0 | 12 | 43 | 2 | 70.8 | -16.6 | 37 | 7.40 |
| Clint Bowyer | 21.4 | 22.2 | 5 | 0 | 0 | 0 | 2 | 0 | 0 | 11 | 38 | 1 | 64.9 | -0.8 | 0 | 0.00 |
| Danica Patrick | 19.8 | 20.2 | 5 | 0 | 0 | 0 | 2 | 0 | 0 | 16 | 24 | 0 | 63.4 | -0.4 | 0 | 0.00 |
| Ty Dillon | 22 | 18.5 | 2 | 0 | 0 | 0 | 2 | 0 | 0 | 17 | 20 | 0 | 64.8 | 3.5 | 0 | 0.00 |
| David Ragan | 26.6 | 26 | 5 | 0 | 0 | 0 | 1 | 2 | 0 | 13 | 33 | 0 | 52 | 0.6 | 0.5 | 0.10 |
| Paul Menard | 16.2 | 28.8 | 5 | 0 | 0 | 0 | 1 | 1 | 0 | 13 | 41 | 1 | 61.6 | -12.6 | 0.25 | 0.05 |
| Erik Jones | 21 | 17 | 2 | 0 | 0 | 0 | 1 | 0 | 0 | 12 | 22 | 0 | 75.4 | 4 | 0 | 0.00 |
| Daniel Suarez | 20 | 19 | 1 | 0 | 0 | 0 | 1 | 0 | 0 | 19 | 19 | 0 | 64.4 | 1 | 0 | 0.00 |
| Matt DiBenedetto | 33.8 | 33.5 | 4 | 0 | 0 | 0 | 0 | 1 | 0 | 31 | 35 | 0 | 34.8 | 0.3 | 0.25 | 0.06 |
| Chris Buescher | 35.5 | 25 | 4 | 0 | 0 | 0 | 0 | 0 | 0 | 21 | 30 | 0 | 51.9 | 10.5 | 0 | 0.00 |
| Michael McDowell | 28.3 | 27.75 | 4 | 0 | 0 | 0 | 0 | 0 | 0 | 23 | 34 | 0 | 47 | 0.55 | 0 | 0.00 |
| Landon Cassill | 30.2 | 28 | 5 | 0 | 0 | 0 | 0 | 0 | 0 | 25 | 32 | 0 | 46.4 | 2.2 | 0 | 0.00 |
| Cole Whitt | 33.8 | 30.5 | 4 | 0 | 0 | 0 | 0 | 0 | 0 | 27 | 35 | 0 | 38.9 | 3.3 | 0 | 0.00 |
| Corey LaJoie | 23 | 32 | 1 | 0 | 0 | 0 | 0 | 0 | 0 | 32 | 32 | 0 | 37.5 | -9 | 0 | 0.00 |
| Gray Gaulding | 29 | 34 | 1 | 0 | 0 | 0 | 0 | 0 | 0 | 34 | 34 | 0 | 33.9 | -5 | 0 | 0.00 |
| Jeffrey Earnhardt | 34 | 36.33 | 3 | 0 | 0 | 0 | 0 | 0 | 0 | 34 | 40 | 1 | 28.2 | -2.33 | 0 | 0.00 |
| Reed Sorenson | 36 | 35.33 | 3 | 0 | 0 | 0 | 0 | 0 | 0 | 35 | 36 | 0 | 29.4 | 0.67 | 0 | 0.00 |
| Joey Gase | 39 | 36 | 1 | 0 | 0 | 0 | 0 | 0 | 0 | 36 | 36 | 0 | 27.8 | 3 | 0 | 0.00 |
| Ray Black Jr. | 0 | 0 | 0 | 0 | 0 | 0 | 0 | 0 | 0 | 0 | 0 | 0 | 0 | 0 | 0 | 0.00 |
Top-15 Drivers at Texas Motor Speedway Historically
| Avg. | Avg. | Laps | High | Low | Difference | Laps Led | Laps Led | ||||||||
| Driver | Start | Finish | Races | Wins | Top 5s | Top 10s | Top 20s | Led | Poles | Finish | Finish | DNF | Pts. | Pts. | Pts./race |
| Jimmie Johnson | 9.4 | 8.11 | 28 | 7 | 15 | 21 | 25 | 1,041 | 1 | 1 | 38 | 1 | 1.29 | 260.25 | 9.29 |
| Matt Kenseth | 14.7 | 9.66 | 29 | 2 | 13 | 18 | 26 | 854 | 1 | 1 | 31 | 0 | 5.04 | 213.5 | 7.36 |
| Kyle Busch | 15.2 | 11.74 | 23 | 2 | 11 | 12 | 19 | 741 | 0 | 1 | 40 | 0 | 3.46 | 185.25 | 8.05 |
| Denny Hamlin | 15.7 | 12.57 | 23 | 2 | 5 | 11 | 20 | 155 | 0 | 1 | 38 | 0 | 3.13 | 38.75 | 1.68 |
| Joey Logano | 12.6 | 15.83 | 18 | 1 | 8 | 8 | 12 | 375 | 0 | 1 | 40 | 1 | -3.23 | 93.75 | 5.21 |
| Dale Earnhardt Jr. | 13.1 | 13.14 | 29 | 1 | 7 | 18 | 23 | 448 | 2 | 1 | 43 | 3 | -0.04 | 112 | 3.86 |
| Kasey Kahne | 14.4 | 18.19 | 26 | 1 | 5 | 9 | 16 | 224 | 1 | 1 | 42 | 4 | -3.79 | 56 | 2.15 |
| Kurt Busch | 14.6 | 15.28 | 29 | 1 | 3 | 16 | 21 | 295 | 1 | 1 | 41 | 2 | -0.68 | 73.75 | 2.54 |
| Ryan Newman | 15.9 | 18.64 | 28 | 1 | 3 | 6 | 18 | 99 | 2 | 1 | 40 | 3 | -2.74 | 24.75 | 0.88 |
| Kevin Harvick | 17.3 | 11.72 | 29 | 0 | 7 | 17 | 25 | 193 | 1 | 2 | 42 | 1 | 5.58 | 48.25 | 1.66 |
| Jamie McMurray | 22 | 16.48 | 27 | 0 | 4 | 10 | 20 | 79 | 0 | 2 | 38 | 1 | 5.52 | 19.75 | 0.73 |
| Brad Keselowski | 16.8 | 15.67 | 18 | 0 | 4 | 7 | 13 | 589 | 1 | 2 | 36 | 0 | 1.13 | 147.25 | 8.18 |
| Martin Truex Jr. | 15.2 | 13.58 | 24 | 0 | 3 | 13 | 20 | 488 | 2 | 2 | 38 | 3 | 1.62 | 122 | 5.08 |
| Clint Bowyer | 16.8 | 15.26 | 23 | 0 | 3 | 10 | 17 | 85 | 0 | 2 | 38 | 2 | 1.54 | 21.25 | 0.92 |
| Kyle Larson | 17.3 | 16 | 8 | 0 | 2 | 3 | 5 | 0 | 0 | 2 | 37 | 1 | 1.3 | 0 | 0.00 |
Top-15 Drivers at 1.5-mile Tracks (since Feb. 2015)
| Avg. | Avg. | Laps | High | Low | Difference | Laps Led | Laps Led | |||||||||
| Driver | Start | Finish | Races | Wins | Top 5s | Top 10s | Top 20s | Led | Poles | Finish | Finish | DNF | Rating | Pts. | Pts. | Pts./race |
| Martin Truex Jr. | 7.4 | 7.5 | 34 | 9 | 14 | 25 | 33 | 2,206 | 3 | 1 | 36 | 1 | 117.2 | -0.1 | 551.5 | 16.22 |
| Jimmie Johnson | 14.7 | 13.15 | 34 | 8 | 13 | 17 | 27 | 771 | 0 | 1 | 41 | 3 | 99.7 | 1.55 | 192.75 | 5.67 |
| Kyle Busch | 9.1 | 9.13 | 30 | 4 | 14 | 20 | 27 | 961 | 2 | 1 | 33 | 1 | 108.5 | -0.03 | 240.25 | 8.01 |
| Brad Keselowski | 6.4 | 10.79 | 34 | 3 | 11 | 25 | 30 | 1,061 | 4 | 1 | 39 | 4 | 101.6 | -4.39 | 265.25 | 7.80 |
| Kevin Harvick | 6.5 | 8.65 | 34 | 2 | 17 | 29 | 31 | 1,896 | 6 | 1 | 42 | 2 | 116.2 | -2.15 | 474 | 13.94 |
| Joey Logano | 7.4 | 11.76 | 34 | 2 | 17 | 23 | 26 | 908 | 2 | 1 | 40 | 3 | 100.4 | -4.36 | 227 | 6.68 |
| Denny Hamlin | 8.5 | 13.38 | 34 | 2 | 14 | 20 | 26 | 410 | 2 | 1 | 41 | 4 | 94 | -4.88 | 102.5 | 3.01 |
| Austin Dillon | 15.9 | 18.76 | 34 | 1 | 3 | 6 | 23 | 14 | 1 | 1 | 43 | 3 | 78.1 | -2.86 | 3.5 | 0.10 |
| Kyle Larson | 15.9 | 16.82 | 34 | 0 | 9 | 14 | 21 | 333 | 0 | 2 | 39 | 4 | 90.3 | -0.92 | 83.25 | 2.45 |
| Chase Elliott | 13 | 14.83 | 24 | 0 | 9 | 14 | 17 | 240 | 0 | 2 | 41 | 4 | 93.1 | -1.83 | 60 | 2.50 |
| Matt Kenseth | 10.3 | 11.85 | 33 | 0 | 8 | 21 | 28 | 477 | 3 | 2 | 42 | 3 | 97.9 | -1.55 | 119.25 | 3.61 |
| Dale Earnhardt Jr. | 17.8 | 12.75 | 28 | 0 | 8 | 13 | 22 | 10 | 0 | 2 | 40 | 0 | 87.2 | 5.05 | 2.5 | 0.09 |
| Kurt Busch | 10.2 | 11.28 | 32 | 0 | 7 | 21 | 28 | 342 | 3 | 2 | 34 | 2 | 93.9 | -1.08 | 85.5 | 2.67 |
| Ryan Newman | 14 | 16.06 | 34 | 0 | 4 | 13 | 24 | 29 | 0 | 3 | 40 | 4 | 79.1 | -2.06 | 7.25 | 0.21 |
| Ryan Blaney | 13.7 | 18.73 | 30 | 0 | 4 | 9 | 19 | 247 | 1 | 3 | 43 | 3 | 79.5 | -5.03 | 61.75 | 2.06 |
Drivers to watch this week:
Jimmie Johnson: Another 1.5-mile track, another Jimmie is at the top of the list in most categories. The 48-car has the most wins, both recently and career-wise, in the field, the most top-fives in both terms, and has finished in the top-10 in 75% of his career races here (21 out of 28). He comes into the race on the outside looking in on the championship, just three points behind Kevin Harvick for the fourth spot. But with his history here, the need to lock in a spot at Homestead for his potential eighth title, and being just the sixth-most expensive driver this week, how can you not play Johnson?
Kyle Busch: Kyle has a luxury no other driver has, he can use the next two weeks to get ready for Homestead instead of having to focus on the race at hand. That being said, he will still try and win every race between here and the end of the season. Texas offers a nice primer for Miami in that they are similar tracks, and Kyle has performed well at both. Busch has run here four times in the last three years, winning once, three top-fives, and three top-10s. Shockingly he’s not near the top of laps led with just 37, but his +12.75 positional differential is second in the field. At $10,600 he’s still playable in both formats..jpg)
Kevin Harvick: Harvick, as mentioned above, is three points to the good right now in fourth place. He also has run well in the Lone Star State. An average finish of 5.0 is third best in the field (second over five races), three top-fives, and five top-10s bolster his argument for how well he likes this track. The 185 laps led recently have him fourth in the field as does his $9,800 price tag but the consistency and need to hold his spot make him dangerous.
Dale Earnhardt Jr.: Jr. has really turned things around in the playoffs, despite not being in them, and just missed a top-10 finish at Martinsville last Sunday. Now he comes to a track that holds a special place as his first, then Winston Cup, win, just 11 races into his career at the top level. In the last four races, missing last fall’s because of the concussion, he’s got the second-best average finish at P4 with three top-fives, including the in the spring this year, and four top-10s. His +18 positional differential is also tops in the field in that span, and his 18 top-10s career-wise are tied for second. At less than $8,000 this week, he is a very solid option for cash lineups.
Chase Elliott: Elliott will be racing here for the fourth time in his MENCS career, but he’s already had great results in the previous three races. Three top-10s and two top-fives in that span, and a +10 positional differential show that he knows how to make it around the 1.5-mile circuit. Before Martinsville, Chase had the second-best average finish in the playoffs behind only, Martin Truex Jr., and we all know what happened at the end of the Martinsville race, likely costing Chase the win, or at worst another top-five finish. Hungry for his first win, and coming to a track at which he has come close at, is a great combination to play him this week.
Martin Truex Jr.: MTJ has been the driver to focus on when it comes to tracks of this distance this season. Six of his seven wins this year have come at 1.5-mile tracks, including in four-straight races. He hasn’t won at Texas…yet, but has finished between P3 and P9 in each of the last five races here, while leading 257 laps, good for second in the field. Truex has a 67-point lead over Jimmie Johnson (who’s in fifth) and with only two races left before the championship, it’s hard to see Truex not making it, even if he doesn’t win here or at Phoenix.
Player News
{{item.text}}
{{analysis.analysis}}