
Fantasy Baseball Draft Guide - Ballpark Factors


Published: Jan 31, 2022
Although we don’t exactly know when at this point, we assume sometime in the near future baseballs will be flying around the parks again. After a tumultuous 2020, we got an on-time start to the 2021 MLB season and all but two teams managed to get 162 games in (the Rockies and Braves played 161). All teams also eventually got to play in their own parks. It took the Toronto Blue Jays until July 30th with detours in Florida and New York, but they finally got there. The Texas Rangers played to fans in their new stadium, giving us now one-and-a-half years’ worth of data at Globe Life Field.
The rules of baseball and the business of baseball may look completely different by the time players take the field for Spring Training. But with just one noticeable exception, fantasy managers, DFS grinders and baseball analysts should have a strong sense of what to expect for park factors in 2022.
Humidor Update (March 31, 2022)
It was recently reported and confirmed that all 30 Major League ballpark will make use of a humidor for their baseballs in 2022. Eno Sarris of The Athletic has been all over this story, and its implications for offense and defense in 2022, but it boils down to a couple key points.
First, this is MLB's way to try and provide some consistency to the baseballs in use, trying to normalize what a ball will do whether it's in Coors Field or Oracle Park. But Sarris believe, and has researched this to back it up, that it will have the opposite effect. The new thought is that a humidor in a dry park (such as Kauffman Stadium) will add moisture to the balls while the humidor will remove it from the balls in a more humid park (such as Petco Park).
Balls that have less moisture can fly farther off the bat, so humid parks like Petco, Oakland Coliseum, and Angels Stadium get a small bump in offense. Sarris identifies players (mostly in the AL and NL West) who could benefit from this change.
One thing is for sure. After three seasons of controversy surrounding “sticky stuff," “rabbit balls,” and “ball tampering,” MLB is looking to remove those elements of the game. It remains to be seen how this will impact all outdoor stadiums in 2022.
Camden Yards
The news that Camden Yards would be adjusting the dimensions of their left-field wall to be more pitcher-friendly was, literally and figuratively, ground-breaking for fantasy managers and DFS players. For years, Baltimore’s home stadium was a haven for offense – especially considering the ineptitude of the Orioles’ pitching staff they seemingly roll out every year.
According to Baseball Savant’s park factors, Camden Yards was the fourth-best park for offense the past three years – including fourth-best for runs and second-best for home runs. Analysis at Swish Analytics notes that home run production for right-handed batters was a 1.20, or 20% above league average. Slugging percentage and on-base percentage for that handedness were also above average.
How might that change? Let’s look at the renderings of the new left field, recently released by the Orioles.
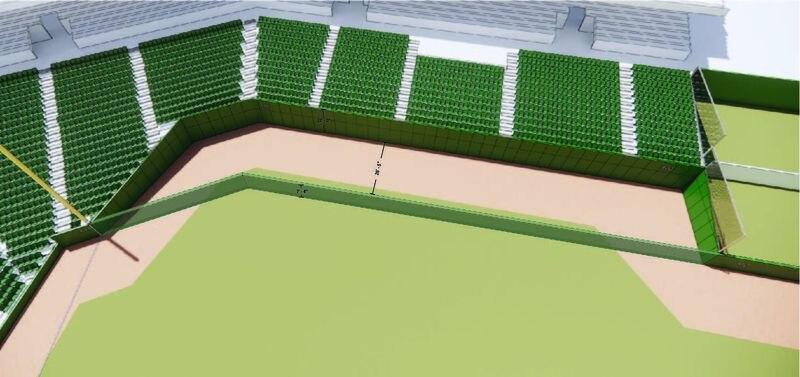
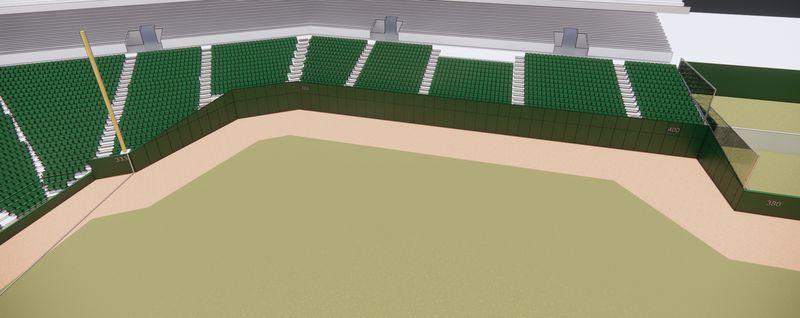
(Images courtesy of the Baltimore Orioles/Baltimore Sun)
In the Baltimore Sun article linked above, they note that since Statcast has been tracking flyball data since 2015, 27.3% of flyballs in the area of the old fence ended as home runs – whereas it would have been 23.95% in all other parks. That may not sound like a lot, but it is about one in every 32-33 flyballs hit.
This potentially impacts the power production from right-handed mashers like Ryan Mountcastle and Trey Mancini, both of whom had SLG% over .495 at home last year. To a lesser extent, Austin Hays and Anthony Santander would also be affected.
But the other side of the coin is that draftable pitchers like John Means get a slight bump up in the rankings. Means had a flyball rate of 47.4% last season and a 15% HR/FB ratio. Almost 43% of Means’ pitches were pulled last year – so as a left-hander, any advantage he can get against righties will boost his value. Bump him up a round if you’re desperate for a late-round starter.
Why Are Park Factors Important for Fantasy?
The Baltimore stadium is a good example of how we can evaluate and utilize park factors to our advantage in fantasy baseball. There are a couple ways we can do this:
- Exploiting lineups in leagues with daily lineup changes or in DFS
- Using park factors as tie-breakers between marginal players in late-round drafting situations
I don’t play in too many leagues any more that have daily lineup changes, but there is certainly a shift among the weekly lineup zealots to allow a mid-week or pre-weekend lineup change once per week. This would be the perfect opportunity to swap out marginal players for another bench player who might be facing second-tier pitchers at Great American Ballpark or stream pitchers who might face the Marlins at loanDepot Park (eighth-lowest in homerun park factor).
In drafting, park factors can help make a snap decision between two otherwise similar players. Consider this example: In NFBC leagues, Wil Myers (OF76) and Garrett Hampson (OF74) are picked within three slots of each other in January drafts. Here are some 2021 comparisons:
| Player | PA | HR | SB | OPS | Avg. Exit Velocity | Hard Hit% | Projected Lineup # |
| Wil Myers | 500 | 17 | 8 | 0.768 | 87 MPH | 37% | 6th |
| Garrett Hampson | 494 | 11 | 17 | 0.669 | 88 MPH | 31% | 9th |
There are some clear things that separate them (on base percentage being one), but a lot of similarities there. If you need a few more homers, you might prefer Myers. If you are short on steal, Hampson might be your man.
But all things being equal, we can look at how vastly different their playing environments are.
Coors Field 3-Year Park Factor Averages:
Runs – 1st
Hits – 1st
Home Runs – 5th
Doubles – 3rd
Petco Park 3-Year Park Factor Averages:
Runs – 26th
Hits – 29th
Home Runs – 18th
Doubles – 19th
Certainly, many other factors come into play and this just considers them in a vacuum. But 81 potential games at Coors Field or Great American Ball Park could be a useful tie-breaker.
Best Offensive Parks
According to Statcast data on Baseball Savant, here are the top three offensive parks for each of these categories from 2019-2021:
| Runs | Hits | Singles | Doubles | Home Runs | Strikeouts | Overall |
| Coors Field | Coors Field | Coors Field | Fenway Park | Great American Ball Park | Coors Field | Coors Field |
| Fenway Park | Kauffman Stadium | Kauffman Stadium | PNC Park | Camden Yards | Kauffman Stadium | Fenway Park |
| Great American Ball Park | Fenway Park | Chase Field | Coors Field | Dodger Stadium | Busch Stadium | Great American Ball Park |
Takeaways: We knew that Coors and GABP were hitter’s paradise, but Fenway and Kauffman have been quite friendly offense as a whole, although not necessarily home runs.
Best Pitcher Parks
According to Statcast data on Baseball Savant, here are the top three pitcher-friendly parks for each of these categories from 2019-2021:
| Runs | Hits | Singles | Doubles | Home Runs | Strikeouts | Overall |
| T-Mobile Park | Petco Park | Rogers Centre | Gauranteed Rate Field | Oracle Park | T-Mobile Park | T-Mobile Park |
| Oracle Park | T-Mobile Park | Gauranteed Rate Field | T-Mobile Park | Kauffman Stadium | Tropicana Field | Oracle Park |
| Oakland Coliseum | Gauranteed Rate Field | Petco Park | Yankee Stadium | PNC Park | Oracle Park | Oakland Coliseum |
Takeaways: Looking for a reason to throw an extra dollar or two at Robbie Ray or Logan Gilbert this year? T-Mobile Park looks like the park pitchers dream about.
What to Watch For in 2022
Besides the drastic effects the fence will have on Camden Yards, there are a number of things we can watch out for in terms of park factors.
We obviously don’t have three years of data on Globe Life Field in Arlington. The 2022 park factors ranked the Rangers’ stadium 21st overall, 16th in home runs and 16th in hits. Overall, that’s about as neutral as a park can get. Where we can use Globe Life to our advantage, however, would be in the early or late months of the year when they might have the roof open for games. Open air typically allows balls to fly farther, so monitor the roof situation for each series to determine whether or not there are matchups to exploit.
Before last year, San Francisco made modifications to Oracle Park, which seemingly had drastic effects. Many of their fences were brought in as much as eight feet around the outfield and the results have been shocking. As noted above, the three-year averages slot Oracle Park as the second-best park for pitchers over that timeframe. However, just the 2021 data told us that Oracle Park was 20th overall and 13th in hits. This shift could transform one of the league’s best pitcher parks into a much more neutral environment that doesn’t scare us from streaming or rostering batters.
Good luck out there this season and hopefully the baseballs are flying around the park again soon!
Player News
{{item.text}}
{{analysis.analysis}}