

You don't need to be a DFS aficionado to know the handedness match-up of hitter and pitcher is a big influence on the outcome. Major League baseball has become a game of specialization to take advantage of this from both sides. With respect to hitting, many teams will deploy a platoon where a position is shared and that night's starter is determined by whether there's a right-hander or left-hander on the mound. With regards to pitching, bullpens run deep enough to allow multiple pitching changes to make sure the pitcher is facing the same handedness batter as much as possible. In fact, John Sickels coined the term LOOGY (lefty one out guy) as a means to identify a left-handed relief specialist.
There are two primary applications of handedness and DFS. The first is more intuitive. We're really not looking for players to produce commensurate with their expectation but rather trying to identify players with a chance to go off that game. A hitter with the platoon advantage over a pitcher has a better chance of a great night than a player of like handedness. This is more subjective since you can't really quantify the probability the player goes nuts.
However, something than can be objectively determined is how much the handedness influences the players projection for that match-up. Season-long projections incorporate all plate appearances. As has been described, I supply Fantasy Alarm with daily projections. The handedness of the match-up helps fine tune the season long projection into a daily projection.
The method involves taking the neutral projection and adjusting each component that is involved with DFS scoring by the impact of handedness. The chance a hitter gets a single, strikes out, walks, goes yard, etc. differs if he's facing a righty or lefty. What I do is look at each of the pertinent stats and adjust them according to the global results - more on that in a minute.
Before we get a little geeky with some math, here's a graphical look at how various skills are influenced by handedness. To make the results as relevant as possible, the hitters excluded pitcher and pinch-hitter plate appearances while the pitching data is strictly versus starters. Data from 2012-2014 was investigated.

Let's review each briefly.
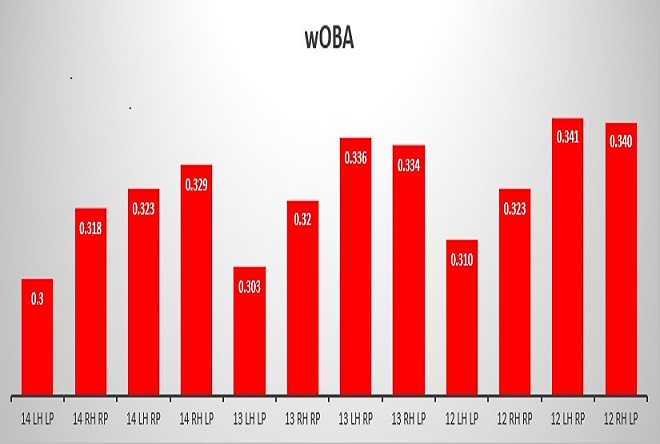
wOBA: As expected, the lowest wOBA occurs when a left-handed hitter faces a southpaw. Next is right on righty. What's interesting is the LHH vs. RHP and RHH vs. LHP results flip-flopped in 2014. The actual results are important. What's keep is the pattern was not consistent so if you built a model and assumed the 2015 adjustment was the same as last season, your model is a little inaccurate.
BABIP: While some of BABIP for an individual player is luck-driven, when you're looking at the sample of a season, the luck fleshes out and BABIP can be considered to be a result of line-drive hitting skill. Previous to last season, it appeared there was some level of skill exhibited by the pitcher since the same handedness BABIP were both lower. However, things aren't so clear in 2014. Is this luck? is it the shift? Even before last season the results weren't significant enough to do anything other than ignore handedness and not worry about BABIP. But as a fan. it's an intriguing development that bears following.
Strikeout rate: Lefty hitters fan most against lefty throwers, next is righty on righty and again the opposites flip.
Walk rate: ?Curiously the walk rate's trend has been consistent all three seasons. It's also interesting that the fewest percentage of free passes are drawn by right on right but the difference between left on left is minute.
Home Run Rate: Homers are obviously hugely important to DFS scoring. The biggest take-home message isn't so much the numbers but if you're playing in a tournament, you really don't want to use left-handed power hitter against a southpaw on the hill since the home run rate is so much lower than the other match-ups.
Isolated Power: This is mostly a sanity check just to make sure nothing wonky is happening. The results are as expected.
If you're just setting lineups intuitively, the above graphs emphasize the importance of focusing on opposite handedness match-ups.
But remember, the impetus of this is to take you through what I do to generate the site's daily projections. You many wonder why actual adjustments are necessary. Why not simply use the player's own splits?
Some of you aren't going to like this but the answer is sample size. Research shows it takes about five full seasons in the Majors for a player to own his splits. Anything less than that needs to be regressed towards league norm. You can't look at how a player is doing in-season and call that his platoon split - the sample is too small. You should always expect that a player perform at league average splits until he's been in the league five years.
All that said, regression is movement towards the mean. The expectation for players without ample playing time should be a weighted average between his career splits and league average. So while a player may not completely own his splits, the closer to the necessary threshold, the less they need to be regressed.
To wrap it up, if you use the site projections, don't worry, just look at the pretty graphs as a baseball fan since they're kind of cool to just think about. If you're more of a feel DFS player, now you have an idea why handedness matters and you can add that to your Zen.
Player News
{{item.text}}
{{analysis.analysis}}