
Depending on who you ask, this week is either the first or second short track race of the year depending on if you count Phoenix as a short track or not. Personally this is the first short track of the year with the typical bumping and banging and tight quarters that short tracks are known for. To be specific this is also the shortest track on the schedule at just 0.526 miles per circuit.
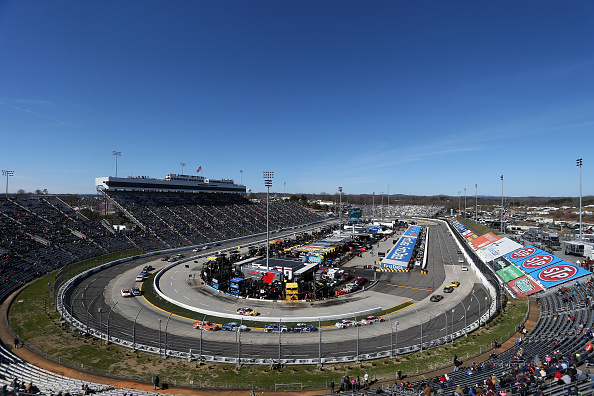
Martinsville Speedway is one of the oldest tracks on the NASCAR lineup and it is the only track to hold a race every year that NASCAR has existed, in case you wanted that interesting piece of knowledge. It’s known affectionately as “The Paperclip” because of it’s shape when seen from above or in the stands and it is also the only track on the NASCAR circuit to have asphalt straightaways and concrete in the turns which can make finding the balance in the car a tricky setup task especially depending on the weather.
The track is a pretty flat lap with just 12 degrees of banking in the turns and none on the straightaways. Those straights are just 800-feet in length each which are the shortest on the schedule much like everything about this track. It’s also a very narrow racing surface making it tough to pass especially in the turns were an actual physical curb keeps you from going below the bottom groove of the track. Now, that being said, Goodyear brought new tires the last couple of years and it has increased the amount of side-by-side racing that can happen because of how much rubber gets laid on the surface. That’s the key to passing here is having a rubbered up track to increase the grip, especially in the turns where the concrete doesn’t hold the rubber as well as the asphalt does.
Starting Positions of Race Winners
| Starting Pos. | Races Won |
| 1 | 21 |
| 2 | 15 |
| 3 | 15 |
| 4 | 14 |
| 5 | 7 |
| 6 | 8 |
| 7 | 8 |
| 8 | 2 |
| 9 | 6 |
| 10 | 5 |
| 11 | 2 |
| 12 | 2 |
| 13 | 2 |
| 14 | 7 |
| 15 | 4 |
| 16 | 1 |
| 17 | 4 |
| 18 | 1 |
| 19 | 2 |
| 20 | 3 |
| 21 | 2 |
| 22 | 1 |
| 23 | 2 |
| 24 | 1 |
| 36 | 1 |
As the above table shows, there have been 140 races at Martinsville since 1948 and 21 of them have been won by the pole sitter, 15-percent, with it happening three times since 2010. The top-four starting spots in the grid have accounted for 65 winners or 46.4-percent of all winners. In four of the last five STP 500s the top-two laps led leaders have accounted for 350-plus laps led of the 500 in the race.
The data will be a bit different this week since there is no comparable track to Martinsville there is no “Similar Track” section but there is a new section going forward called “Momentum”
Track Data
Drivers To Watch This Week
Last Five STP 500s
| Avg. | Run | Avg. | Pos. | Top | Top | Top | Top | |||
| Driver | # | Start | Pos. | Finish | Diff. | W | 5 | 10 | 15 | 20 |
| Brad Keselowski | 5 | 9 | 12.4 | 11.2 | -2.2 | 1 | 3 | 4 | 4 | 4 |
| Kyle Busch | 4 | 5 | 5.8 | 4.8 | 0.2 | 1 | 3 | 3 | 4 | 4 |
| Clint Bowyer | 5 | 17.8 | 13.2 | 11 | 6.8 | 1 | 1 | 3 | 4 | 4 |
| Kurt Busch | 5 | 19.2 | 13.4 | 15.2 | 4 | 1 | 1 | 1 | 4 | 4 |
| Denny Hamlin | 5 | 8.6 | 13 | 20.2 | -11.6 | 1 | 1 | 1 | 2 | 3 |
| Joey Logano | 5 | 2.6 | 9.2 | 5.6 | -3 | 0 | 3 | 4 | 5 | 5 |
| Austin Dillon | 5 | 23.4 | 21 | 19 | 4.4 | 0 | 2 | 2 | 3 | 3 |
| Kevin Harvick | 5 | 14.2 | 9 | 11.4 | 2.8 | 0 | 1 | 3 | 3 | 5 |
| Martin Truex Jr | 5 | 10.8 | 12.4 | 13 | -2.2 | 0 | 1 | 2 | 2 | 4 |
| Jimmie Johnson | 5 | 13.6 | 12.2 | 15.2 | -1.6 | 0 | 1 | 2 | 4 | 4 |
| Chase Elliott | 4 | 15 | 19.5 | 17.5 | -2.5 | 0 | 1 | 2 | 2 | 3 |
| Kyle Larson | 4 | 13.3 | 13.3 | 15.8 | -2.5 | 0 | 1 | 1 | 1 | 3 |
| Ryan Blaney | 3 | 8 | 11 | 15.7 | -7.7 | 0 | 1 | 1 | 1 | 2 |
| David Ragan | 5 | 25.6 | 23.4 | 20.6 | 5 | 0 | 1 | 1 | 1 | 1 |
| Avg. | Run | Avg. | Pos. | Top | Top | Top | Top | |||
| Driver | # | Start | Pos. | Finish | Diff. | W | 5 | 10 | 15 | 20 |
| Paul Menard | 5 | 15 | 15.8 | 14.6 | 0.4 | 0 | 0 | 2 | 3 | 4 |
| Ryan Newman | 5 | 9.6 | 16.2 | 16.8 | -7.2 | 0 | 0 | 2 | 2 | 4 |
| Aric Almirola | 5 | 17.2 | 19.2 | 18.4 | -1.2 | 0 | 0 | 1 | 3 | 4 |
| Alex Bowman | 3 | 24.7 | 28.3 | 26.7 | -2 | 0 | 0 | 1 | 1 | 1 |
| Ricky Stenhouse Jr | 5 | 21.4 | 29.8 | 31.8 | -10.4 | 0 | 0 | 1 | 1 | 1 |
| Erik Jones | 2 | 14 | 16 | 14.5 | -0.5 | 0 | 0 | 0 | 1 | 2 |
| William Byron | 1 | 20 | 21 | 20 | 0 | 0 | 0 | 0 | 0 | 1 |
| Chris Buescher | 4 | 31.5 | 26.3 | 22.8 | 8.7 | 0 | 0 | 0 | 1 | 1 |
| Daniel Suarez | 2 | 21 | 26.5 | 25 | -4 | 0 | 0 | 0 | 0 | 1 |
| Ty Dillon | 2 | 27.5 | 23 | 22 | 5.5 | 0 | 0 | 0 | 0 | 0 |
| Michael McDowell | 4 | 27.3 | 27 | 27 | 0.3 | 0 | 0 | 0 | 0 | 0 |
| Avg. | Run | Avg. | Pos. | Top | Top | Top | Top | |||
| Driver | # | Start | Pos. | Finish | Diff. | W | 5 | 10 | 15 | 20 |
| Landon Cassill | 5 | 33.2 | 29 | 27.8 | 5.4 | 0 | 0 | 0 | 0 | 0 |
| DJ Kennington | 1 | 37 | 31 | 28 | 9 | 0 | 0 | 0 | 0 | 0 |
| Corey LaJoie | 1 | 35 | 32 | 28 | 7 | 0 | 0 | 0 | 0 | 0 |
| Ross Chastain | 1 | 33 | 31 | 29 | 4 | 0 | 0 | 0 | 0 | 0 |
| Matt DiBenedetto | 4 | 34.3 | 31.3 | 31.8 | 2.5 | 0 | 0 | 0 | 0 | 0 |
| Bubba Wallace | 1 | 19 | 34 | 34 | -15 | 0 | 0 | 0 | 0 | 0 |
| Cody Ware | 0 | 0 | 0 | 0 | 0 | 0 | 0 | 0 | 0 | 0 |
| Daniel Hemric | 0 | 0 | 0 | 0 | 0 | 0 | 0 | 0 | 0 | 0 |
| Matt Tifft | 0 | 0 | 0 | 0 | 0 | 0 | 0 | 0 | 0 | 0 |
| Ryan Preece | 0 | 0 | 0 | 0 | 0 | 0 | 0 | 0 | 0 | 0 |
| Laps | Laps Led | Fastest | Fast Laps | Top-15 | Avg. | Laps | ||
| Driver | # | Led | /Race | Laps | /Race | Rate | Rating | Comp. |
| Brad Keselowski | 5 | 135 | 27.0 | 241 | 48.2 | 76% | 102.7 | 2469 |
| Kyle Busch | 4 | 672 | 168.0 | 256 | 64.0 | 88% | 122.1 | 2000 |
| Clint Bowyer | 5 | 231 | 46.2 | 117 | 23.4 | 66% | 93 | 2497 |
| Kurt Busch | 5 | 44 | 8.8 | 46 | 9.2 | 67% | 86.9 | 2295 |
| Denny Hamlin | 5 | 226 | 45.2 | 142 | 28.4 | 74% | 90.7 | 2214 |
| Joey Logano | 5 | 169 | 33.8 | 129 | 25.8 | 81% | 107 | 2500 |
| Austin Dillon | 5 | 0 | 0.0 | 13 | 2.6 | 36% | 71.8 | 2323 |
| Kevin Harvick | 5 | 227 | 45.4 | 191 | 38.2 | 80% | 102.5 | 2500 |
| Martin Truex Jr | 5 | 69 | 13.8 | 50 | 10.0 | 76% | 86.1 | 2500 |
| Jimmie Johnson | 5 | 296 | 59.2 | 101 | 20.2 | 75% | 96.5 | 2467 |
| Chase Elliott | 4 | 20 | 5.0 | 57 | 14.3 | 38% | 76.9 | 1926 |
| Kyle Larson | 4 | 23 | 5.8 | 25 | 6.3 | 71% | 83.6 | 1997 |
| Ryan Blaney | 3 | 145 | 48.3 | 35 | 11.7 | 69% | 92.5 | 1498 |
| David Ragan | 5 | 0 | 0.0 | 10 | 2.0 | 15% | 59.5 | 2489 |
| Laps | Laps Led | Fastest | Fast Laps | Top-15 | Avg. | Laps | ||
| Driver | # | Led | /Race | Laps | /Race | Rate | Rating | Comp. |
| Paul Menard | 5 | 10 | 2.0 | 30 | 6.0 | 55% | 77.6 | 2499 |
| Ryan Newman | 5 | 2 | 0.4 | 18 | 3.6 | 44% | 76.6 | 2493 |
| Aric Almirola | 5 | 0 | 0.0 | 36 | 7.2 | 41% | 71.6 | 2206 |
| Alex Bowman | 3 | 0 | 0.0 | 21 | 7.0 | 21% | 55.8 | 1432 |
| Ricky Stenhouse Jr | 5 | 0 | 0.0 | 20 | 4.0 | 7% | 46.2 | 2248 |
| Erik Jones | 2 | 0 | 0.0 | 9 | 4.5 | 37% | 74.4 | 997 |
| William Byron | 1 | 0 | 0.0 | 0 | 0.0 | 0% | 62.7 | 497 |
| Chris Buescher | 4 | 0 | 0.0 | 2 | 0.5 | 9% | 50.4 | 1986 |
| Daniel Suarez | 2 | 0 | 0.0 | 15 | 7.5 | 6% | 52.3 | 986 |
| Ty Dillon | 2 | 0 | 0.0 | 2 | 1.0 | 3% | 53.4 | 995 |
| Michael McDowell | 4 | 0 | 0.0 | 0 | 0.0 | 0% | 48.2 | 2355 |
| Landon Cassill | 5 | 0 | 0.0 | 1 | 0.2 | 1% | 44.8 | 2203 |
| Laps | Laps Led | Fastest | Fast Laps | Top-15 | Avg. | Laps | ||
| Driver | # | Led | /Race | Laps | /Race | Rate | Rating | Comp. |
| DJ Kennington | 1 | 0 | 0.0 | 0 | 0.0 | 0% | 34.7 | 493 |
| Corey LaJoie | 1 | 0 | 0.0 | 0 | 0.0 | 0% | 33 | 496 |
| Ross Chastain | 1 | 0 | 0.0 | 0 | 0.0 | 0% | 35.5 | 493 |
| Matt DiBenedetto | 4 | 0 | 0.0 | 1 | 0.3 | 0% | 38.3 | 1878 |
| Bubba Wallace | 1 | 0 | 0.0 | 0 | 0.0 | 0% | 38.5 | 486 |
| Cody Ware | 0 | 0 | 0 | 0 | 0 | 0 | 0 | 0 |
| Daniel Hemric | 0 | 0 | 0 | 0 | 0 | 0 | 0 | 0 |
| Matt Tifft | 0 | 0 | 0 | 0 | 0 | 0 | 0 | 0 |
| Ryan Preece | 0 | 0 | 0 | 0 | 0 | 0 | 0 | 0 |
Top-15 Drivers Over Last 10 Races At Martinsville Speedway
| Avg. | Run | Avg. | Pos. | Top | Top | Top | Top | |||
| Driver | # | Start | Pos. | Finish | Diff. | W | 5 | 10 | 15 | 20 |
| Kyle Busch | 9 | 6.4 | 5.7 | 5 | 1.4 | 2 | 7 | 7 | 9 | 9 |
| Brad Keselowski | 10 | 9.5 | 10.6 | 13 | -3.5 | 1 | 6 | 7 | 7 | 7 |
| Joey Logano | 10 | 2.9 | 6.9 | 10.4 | -7.5 | 1 | 5 | 7 | 8 | 8 |
| Denny Hamlin | 10 | 7.5 | 10.6 | 12.4 | -4.9 | 1 | 4 | 6 | 7 | 8 |
| Clint Bowyer | 10 | 15.3 | 15.4 | 15.7 | -0.4 | 1 | 2 | 5 | 6 | 6 |
| Jimmie Johnson | 10 | 15.7 | 13.8 | 14.5 | 1.2 | 1 | 2 | 3 | 8 | 8 |
| Kurt Busch | 10 | 16.1 | 12.3 | 19.6 | -3.5 | 1 | 1 | 2 | 5 | 5 |
| Martin Truex Jr | 10 | 11.8 | 11.1 | 12.1 | -0.3 | 0 | 3 | 6 | 6 | 8 |
| Kevin Harvick | 10 | 16.1 | 11.5 | 13.3 | 2.8 | 0 | 2 | 6 | 6 | 9 |
| Austin Dillon | 10 | 24.8 | 20.4 | 18.5 | 6.3 | 0 | 2 | 2 | 5 | 7 |
| Ryan Newman | 10 | 11.1 | 14.6 | 13.2 | -2.1 | 0 | 1 | 5 | 6 | 9 |
| Chase Elliott | 7 | 12.4 | 15.1 | 16.6 | -4.2 | 0 | 1 | 3 | 4 | 5 |
| Ryan Blaney | 6 | 7.8 | 12.5 | 15.7 | -7.9 | 0 | 1 | 2 | 2 | 5 |
| David Ragan | 10 | 26.4 | 25 | 22.1 | 4.3 | 0 | 1 | 2 | 2 | 3 |
| Kyle Larson | 9 | 11.9 | 16.6 | 22.2 | -10.3 | 0 | 1 | 1 | 2 | 5 |
| Laps | Laps Led | Fastest | Fast Laps | Top-15 | Avg. | ||
| Driver | # | Led | /Race | Laps | /Race | Rate | Rating |
| Kyle Busch | 9 | 959 | 106.56 | 411 | 45.67 | 94% | 118.7 |
| Brad Keselowski | 10 | 427 | 42.70 | 464 | 46.40 | 78% | 102.9 |
| Joey Logano | 10 | 825 | 82.50 | 334 | 33.40 | 89% | 111.4 |
| Denny Hamlin | 10 | 383 | 38.30 | 318 | 31.80 | 81% | 99.8 |
| Clint Bowyer | 10 | 265 | 26.50 | 210 | 21.00 | 61% | 87.8 |
| Jimmie Johnson | 10 | 412 | 41.20 | 180 | 18.00 | 69% | 94 |
| Kurt Busch | 10 | 87 | 8.70 | 90 | 9.00 | 72% | 87.1 |
| Martin Truex Jr | 10 | 261 | 26.10 | 180 | 18.00 | 77% | 92.5 |
| Kevin Harvick | 10 | 265 | 26.50 | 290 | 29.00 | 75% | 96 |
| Austin Dillon | 10 | 6 | 0.60 | 43 | 4.30 | 35% | 71.4 |
| Ryan Newman | 10 | 2 | 0.20 | 50 | 5.00 | 58% | 82.6 |
| Chase Elliott | 7 | 143 | 20.43 | 132 | 18.86 | 59% | 84.8 |
| Ryan Blaney | 6 | 145 | 24.17 | 48 | 8.00 | 57% | 87.1 |
| David Ragan | 10 | 0 | 0.00 | 34 | 3.40 | 13% | 57.2 |
| Kyle Larson | 9 | 29 | 3.22 | 44 | 4.89 | 54% | 76.2 |
Momentum
This table will be a way to see who’s hot and who’s not over the last five races of the 2019 season overall. Each week it will count the past five races and update the stats over that span.
| Avg. | Run | Avg. | Pos. | Top | Top | Top | Top | Avg. | |||
| Driver | # | Start | Pos. | Finish | Diff. | W | 5 | 10 | 15 | 20 | Rating |
| Kyle Busch | 5 | 9.6 | 5.8 | 2.6 | 7 | 2 | 4 | 5 | 5 | 5 | 124 |
| Joey Logano | 5 | 11.6 | 7.4 | 8 | 3.6 | 1 | 3 | 4 | 4 | 4 | 106 |
| Brad Keselowski | 5 | 18.2 | 12.8 | 7.4 | 10.8 | 1 | 3 | 3 | 4 | 5 | 95.4 |
| Denny Hamlin | 5 | 5 | 8.6 | 6.8 | -1.8 | 1 | 2 | 4 | 5 | 5 | 99.5 |
| Kevin Harvick | 5 | 6.4 | 6.4 | 9.4 | -3 | 0 | 3 | 4 | 4 | 4 | 112 |
| Kurt Busch | 5 | 17 | 13.6 | 9.2 | 7.8 | 0 | 2 | 4 | 4 | 4 | 92 |
| Martin Truex Jr | 5 | 15.8 | 11.8 | 11 | 4.8 | 0 | 2 | 4 | 4 | 4 | 97.5 |
| Ryan Blaney | 5 | 12.8 | 11.4 | 16.6 | -3.8 | 0 | 2 | 2 | 2 | 2 | 95.5 |
| Aric Almirola | 5 | 10.2 | 9.8 | 12 | -1.8 | 0 | 1 | 4 | 4 | 4 | 97 |
| Erik Jones | 5 | 17.8 | 16.2 | 14.2 | 3.6 | 0 | 1 | 2 | 3 | 4 | 77.4 |
| Clint Bowyer | 5 | 12.2 | 14.2 | 17.6 | -5.4 | 0 | 1 | 1 | 3 | 4 | 82.2 |
| Michael McDowell | 5 | 23.6 | 26 | 26.4 | -2.8 | 0 | 1 | 1 | 1 | 1 | 49.8 |
| Kyle Larson | 5 | 17.2 | 13.8 | 9.8 | 7.4 | 0 | 0 | 2 | 5 | 5 | 88.2 |
| Jimmie Johnson | 5 | 12.6 | 14.2 | 15.4 | -2.8 | 0 | 0 | 2 | 2 | 4 | 78.9 |
| Avg. | Run | Avg. | Pos. | Top | Top | Top | Top | Avg. | |||
| Driver | # | Start | Pos. | Finish | Diff. | W | 5 | 10 | 15 | 20 | Rating |
| Ricky Stenhouse Jr | 5 | 9.2 | 13.2 | 12.8 | -3.6 | 0 | 0 | 1 | 4 | 5 | 86.2 |
| Chase Elliott | 5 | 12.4 | 13 | 14 | -1.6 | 0 | 0 | 1 | 3 | 5 | 82.5 |
| Austin Dillon | 5 | 9.6 | 17.6 | 17.6 | -8 | 0 | 0 | 1 | 1 | 3 | 68.3 |
| Chris Buescher | 5 | 21.6 | 20.4 | 19.2 | 2.4 | 0 | 0 | 1 | 1 | 4 | 62 |
| Daniel Suarez | 5 | 19.6 | 15.6 | 19.2 | 0.4 | 0 | 0 | 1 | 2 | 3 | 75.7 |
| Ty Dillon | 5 | 18.6 | 24.4 | 20.4 | -1.8 | 0 | 0 | 1 | 2 | 2 | 54.5 |
| Ryan Preece | 5 | 23.4 | 23.8 | 25 | -1.6 | 0 | 0 | 1 | 1 | 1 | 50.4 |
| Ross Chastain | 5 | 34 | 31 | 25.8 | 8.2 | 0 | 0 | 1 | 1 | 1 | 37.6 |
| Ryan Newman | 5 | 17.2 | 18.2 | 17 | 0.2 | 0 | 0 | 0 | 3 | 3 | 66.6 |
| William Byron | 5 | 13.4 | 14.6 | 18.6 | -5.2 | 0 | 0 | 0 | 1 | 3 | 79.4 |
| Alex Bowman | 5 | 11.6 | 16.2 | 18.6 | -7 | 0 | 0 | 0 | 3 | 3 | 74.5 |
| Paul Menard | 5 | 15.6 | 17.4 | 19 | -3.4 | 0 | 0 | 0 | 2 | 4 | 68.7 |
| Avg. | Run | Avg. | Pos. | Top | Top | Top | Top | Avg. | |||
| Driver | # | Start | Pos. | Finish | Diff. | W | 5 | 10 | 15 | 20 | Rating |
| Brendan Gaughan | 1 | 30 | 28 | 23 | 7 | 0 | 0 | 0 | 0 | 0 | 49.9 |
| Matt DiBenedetto | 5 | 20.8 | 18.6 | 24.2 | -3.4 | 0 | 0 | 0 | 0 | 1 | 66.2 |
| David Ragan | 5 | 20.2 | 23.8 | 24.8 | -4.6 | 0 | 0 | 0 | 0 | 1 | 52.6 |
| Parker Kligerman | 3 | 30.3 | 29.7 | 25.3 | 5 | 0 | 0 | 0 | 1 | 1 | 41.8 |
| Daniel Hemric | 5 | 18 | 21.2 | 25.6 | -7.6 | 0 | 0 | 0 | 0 | 2 | 61.2 |
| Corey LaJoie | 5 | 28 | 30 | 26.2 | 1.8 | 0 | 0 | 0 | 0 | 1 | 40.4 |
| Tyler Reddick | 1 | 39 | 23 | 27 | 12 | 0 | 0 | 0 | 0 | 0 | 61.9 |
| Bubba Wallace | 5 | 22.8 | 27 | 28.6 | -5.8 | 0 | 0 | 0 | 0 | 0 | 48.3 |
| Matt Tifft | 5 | 32.2 | 27.8 | 28.8 | 3.4 | 0 | 0 | 0 | 0 | 1 | 42.7 |
| Quin Houff | 1 | 35 | 33 | 30 | 5 | 0 | 0 | 0 | 0 | 0 | 28 |
| Landon Cassill | 5 | 31.2 | 31.6 | 30.4 | 0.8 | 0 | 0 | 0 | 0 | 0 | 37.4 |
| Bayley Currey | 1 | 36 | 33 | 31 | 5 | 0 | 0 | 0 | 0 | 0 | 27 |
| BJ McLeod | 4 | 36.3 | 35.5 | 31.3 | 5 | 0 | 0 | 0 | 0 | 1 | 29.5 |
| Cody Ware | 5 | 34.8 | 34.4 | 34.2 | 0.6 | 0 | 0 | 0 | 0 | 0 | 29 |
| Reed Sorenson | 2 | 36 | 35 | 35 | 1 | 0 | 0 | 0 | 0 | 0 | 28.9 |
| Garrett Smithley | 2 | 36 | 36.5 | 36 | 0 | 0 | 0 | 0 | 0 | 0 | 25.8 |
| Joey Gase | 2 | 37 | 37 | 36.5 | 0.5 | 0 | 0 | 0 | 0 | 0 | 24.4 |
DraftKings Scoring for Last Five STP 500s
FanDuel Scoring for Last Five STP 500s
Rankings for STP 500 (1=Best, 40=Worst)
The Race Hist column ranks the average finish over the last five specific races at the track. The DK and FD Avg columns rank the drivers scoring averages over that span on those sites amongst the field. The Track History ranks the average finish over the last 10 races overall at the track.