
Fantasy Baseball Draft Guide - Understanding Projections & Category Targets


Published: Feb 19, 2022
Without any context, ITS JUST NUMBERS!
In June 2021, the batting average in Major League Baseball for the season was .236, the lowest ever. The pitchers were relying on a pine tar residue to increase the spin rate. Using the “sticky stuff” can increase a pitcher’s spin rate by as much as 17-18% as was the case with Trevor Bauer. Hitters were absolutely dominated. By the end of the season, the league batting average rose to an almost normal .244 after the crack-down came down from the umpires and league.
There was a rumor that to make up for this, Major League Baseball began using a mix of juiced balls and the less tightly wound balls that had helped drive averages and home runs down. Rumor is that this mix will continue this year. Holy Russian Roulette, Batman. If I crush the ball, but it is one that is less wound, I could fly out to the short center field. If I miss the sweet spot, but it is a juiced ball…BAM - YARD WORK!
These kinds of changes wreak havoc with projections. Will it be by ballpark, game, team-based on shipments of balls or will they be actually be mixed and then shipped? FREAKING CRAZY to predict home runs.
Then, add a designated hitter added to the National League. This affects pitchers and hitters:
- Increased Pool for NL Only Leagues – You now need to identify how each team handles the DH. Will teams use a steady DH or use it to rest a position player, especially at tough positions like catcher?
- More Innings for NL Starters – Pitchers will not be removed for pinch hitters.
- Higher ERA & WHIP Plus Less Strikeouts for NL Pitchers – Facing better hitters in the 9th spot in the lineup causes starting pitchers to see 2-3 less easy outs a game.
- Better Protection – The 6th hitter in the lineup will be much better with a player protecting him to give him more fastballs in hitters’ counts. Just one more thing to push batting averages and run production.
Let’s examine statistics, projections, and category targets, we need to keep ALL the above in mind too.
Reviewing Recent History of Stat Categories
Examining home runs. Last year there were five players to hit more than 40 home runs and 43 who hit more than 30 home runs. To complete the picture, 102 players hit 20 or more home runs. The total number of home runs was 5944, 5% down from the interpolated 2020 season. Based on that, some would argue that you need to get as many 30+ home run hitters as possible. Looked at the projected home runs in multiple systems and the lowest I found was 5100 while the highest was almost 7000 which would set a record. Certainly, possible with the NL adopting the DH but unlikely.
Examining stolen bases. Only six players had more than 30 stolen bases and the only two players had over 40 stolen bases. They were 32-year-old veterans in Starling Marte and Whit Merrifield. There were a total of 2213 stolen bases in 2021. Again, many projection services are overplaying stolen bases as they project growth for players and do not factor in injuries since players who steal more bases get hurt more often. When reviewing projection services, I found about 2700 stolen bases which would be more than in any year since 2010. FanJections for FantasyAlarm.com has 2157 which seems much more likely.
For the first 15 years that I played fantasy baseball, I was a slave to the numbers. My first fantasy baseball season was 1989. Canseco went 40-40 as the most valuable fantasy baseball player. Not sure how much was juice. Throughout the 90s, we had to take juice into account. Was a player using PEDs? Naively thinking that the projectionists that I depended on took EVERYTHING into account, I forged on.
Now, I find both projections and category targets to be incredibly important to the success in drafting winning fantasy baseball teams. However, you need to use them carefully knowing that projections are flawed in many ways can help you change your thinking about many players and win more often.
Some facts about projections: (1) the game changes constantly and projectionists do not always catch up; (2) the human element of players can never be included like when a player is traded or a contract year is upon us; (3) upside cannot be included in projections as the goal is to be accurate; (4) hype is often included way too much; (5) many projections are a regurgitation of the previous year's stats with minor changes to avoid being judged too harshly.
Let's start our work here by examining historical numbers with the lens of age and its effect on home runs and stolen bases.
First, the chart below shows the age of home run hitters. I added the projected numbers so you can see how the projections travel back to the previous year which usually is not the case.

Notice the anomaly in the data here. Normally, the largest number of 30+ home run hitters are between 25 and 27 years old with the largest boost in power happening in the age 26 season. Last year, many more older players hit more home runs. Will this continue?
Now let’s look at stolen bases.

Players who run tend to keep running until they turn 27. After 27, they go steadily down. There are the exceptions to this of course, like the aforementioned Starling Marte. The reason for this is because of the more prolific home run hitting and no one wants to run their team out of an inning and well, Father Time.
Looking at Trends
A major flaw in projections is that they do not consider the changing game. Here are four trends in Major League Baseball that affect what we do for projections: (1) hitters are sacrificing batting average for home runs more each year; (2) more teams are employing defensive tactics like the shift which is lowering batting averages; (3) starting pitchers are throwing fewer innings because of the individual roles; (4) the changes in the ball and the rules against the “sticky stuff”.
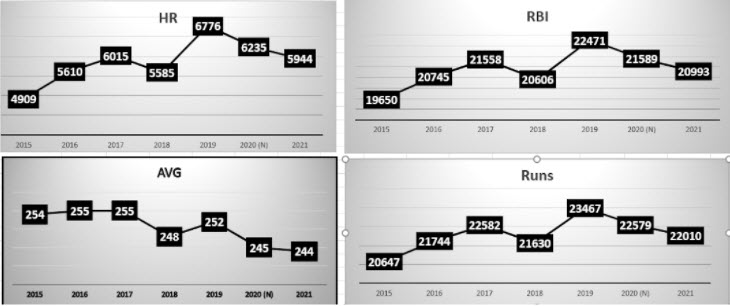
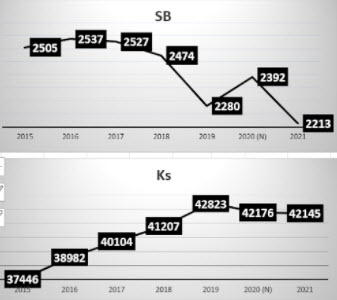
Home runs last year were up 21.1% since 2015 and down 4.7% from the interpolated 2020. Stolen bases down 12.8% since 2016 and down 7.5% from the interpolated 2020.
With batting average hitting historic lows, high average players can skew your roster for the good and low average players simply will not hurt you as much. Pay to get players who get BOTH stolen bases and home runs since the cost of stolen base only players to the rest of your roster will cause you to fall short in the other counting categories. How can you do that? Of the 19 players with more than 20 stolen bases, 10 of them also had 20 home runs. Get those guys at a premium.
Now look at pitching and we get some interesting insights here too. For saves, it is a wash as the 1191 is statistically close to the 1180 from 2019 so nothing changes there. Follow the Smart System when drafting and get at least one solid closer for a good team. Walks were significantly down while the strikeouts were not up drastically. This is likely because players were hitting the ball more as you notice that the WHIP was almost identical year on year. Now, the only interesting thing here is in ERA. The earned run average for pitchers dropped closer to 2018 levels. This is likely a byproduct of the “sticky stuff” for the first half of the season.


We did not include the Wins category as there is the same number of wins every year. It is important to understand that the wins are now being taken by middle relief and late relief pitchers more often, but there is the same number of wins so no trends. It is a good strategy in “ONLY” leagues to look for and target a team’s “vulture”, the player who enters the game when the game is tied. That pitcher intrinsically gets more wins. It is not a strategy for mixed leagues as you can find better starters with a higher win probability and more strikeouts.
What We Know
- Wins are getting scooped up more by middle relief pitchers.
- Roles are causing starting pitchers to pitch less innings. There were only 6 pitchers with more than 200 innings pitched last year after normalizing to 162 games. ONLY 6. There were 14 in 2019 and this is going down every year.
- Saves are decreasing every year, so you need to get the guaranteed closers to get enough of those.
- ERA rising for the bottom starters, bulk pitchers, and middle relievers. Stud starting pitchers still delivering so need to be targeted.
- Home runs inflated by removal of the sticky stuff and half the balls being juiced.
- Stolen bases are super scarce and going down further.
What Actions We Should Take
- Draft starting pitching earlier and spend more on starting pitching on the top end. Those pitchers will allow you to dominate four of the five pitching categories.
- Draft steals with home runs when you can, especially the 10 players who do both.
- Draft home run only players later in the draft as you must get enough power.
- Batting average only players are no longer necessary. They will not do enough to make up for the home runs that you will lose.
- Stolen base only players are difficult to the roster as well. You need fifteen plus home runs from every player on your roster. You can roster a 15-home run and 30 steals player, but not a 5-home run and 40 steals player.
The upside is always lost with projections.
All projectionists try to come up with the most likely performance of all the players. This causes many to miss on the outliers. Getting more players right means that they will have a wider margin of misses on the high-end and low-end of the spectrum.
Here is an important corollary: Be careful that you ALWAYS look for UPSIDE in your picks and then let the projections define your targeting. That way you will always have way more stats than your projections sheet.
Hype & Regurgitation
Every year there are players everyone thinks will be the next Barry Bonds (yes, the best fantasy player ever). Need to make sure that you follow the SMART System and stay away from players with less than a full season in the majors. We like to use 800 at-bats as the marker for what is acceptable to chase full value for a player. Too often players take time to adjust or have enough at-bats taped for pitchers to review and find their holes. Look at Vlad two years ago, he was the “can’t miss” prospect who proved that in 2021. However, all his owners in the previous year overpaid. Watch out for the players that are being hyped for age. Watch out for “best shape of my life” statements. Instead, get behind when a pitcher has a new pitch or moves to a pitching park. That is real.
Regurgitation is bad. Really bad. Don’t use last year’s stats as your projections. Period. Full stop.
Support Your League Rules
Make sure your projections have the statistics that your league uses. If your league uses holds, make sure you start with projections that have holds. If your league uses quality starts (QS), make sure you start with projections that have QS. Obvious, but stated just in case.
Using Projections for Targeting Players
Now, why are we doing this? Well, it is to learn more about the players that you should target and how to build your roster. Here is how you should use projections to target players.
First, review projections by sorting them by each category that your league uses. Review the players from a lens of them helping your team in that category. Look for players experts are not high on and take down their names. Getting bargains that help you in tough categories like stolen bases or saves are important for you to know about.
Using Projections for Targeting Categories
Now we understand the changing game and how to decide on your projections. Let’s connect that to the categories. Remember, knowledge is power.
Here are some rules about setting your category targets:
- Don’t Look at Winner for Targets: Look at the Top 25% for your target. Finishing in the Top 25% in all categories makes you a winner in your league.
- Category dominators: Look at players who are Category dominators and consider them when potentially down against your targets.
- Get SBs from Every Player: When targeting hitters, make sure that you get some steals.
- Move $$ or Drafting to Stud SPs: Target the high innings 200 strikeout guys early and often.
- Don’t Dump Categories: Only the best players can win this way. I am not one of them. Think of myself as top 10% player, but it takes an incredible amount of skill and effort both in the draft and in-season. If that, is you, then why the heck are you reading this article for?
Here is a chart that specifies the targets that I use in the leagues that I play in. Again, examine your leagues to see if there are anomalies based on league members dumping categories or playing in a different way than the leagues that I play in.

Using a Tracking Sheet for Projections & Targeting Categories
After all these years, I still use some complicated tracking spreadsheets. No software. Just makes me in control of what I know. They are created and augmented year after year. You can start simple. Just have a sheet with your players and the scoring categories that your league uses. Using something that looks like this. This is from the Colton & The Wolfman team that won Tout Wars AL Only League in 2021.

Notice that by tracking targets, we were able to adjust the end game to get some speed with Cedric Mullins who turned into a league winner. If we had not been tracking targets, we would have gone with a different upside player. On the pitching side, after closers went too high, we were forced to ABANDON targets completely to take a lot of relief pitchers behind unproven or unsteady closers. We would attack in reserve picks and in-season to make up for the starting pitching that was under-drafted. Never be a slave to the targets.
There is a lot here and you do not need to use it all. If anything in here helped you, then that is one more thing in your arsenal. Don’t be a slave to projections or targets. Use them as tools along with your knowledge at finding players who will deliver upside.
If you want any of these spreadsheets or have any questions, I am always available at rick@fantasyalarm.com.
Winners “make” it happen. Losers “let” it happen.
MAKE IT HAPPEN!