

 In 1989, I programmed super boring systems for IBM’s Prodigy and read the National every day. Every night, I hit the local bar with friends, watched baseball, shot pool and drank Molson Golden Ale. When the concept for a simulation game called Baseball Manager came into the development queue at IBM, I immediately volunteered. My boss saw me reading the National one day and knew I volunteered for Baseball Manager and said “Wolf, you want to play in the Prodigy Rotisserie league?” I said “Sure, can we be partners in it since I have no f^%ing idea what you’re talking about?”
That was the start of Harold “Tip” Topper teaching me fantasy baseball in the second league ever hosted on Allstar Stats. I read everything I could from Baseball Forecaster from Ron Shandler to the Bill James Handbook to the Baseball Weekly every week. I watched baseball, but I was a computer nerd who had access to raw data, you would think I would have used built models, done projections…Nope.
Finally Used Projections
 In 1995, when we started SportsLine USA (CBSSports.com) in Ft Lauderdale, I looked at the fantasy games as raw numbers especially the salary cap games as that added a new number. I relied 100% on projections to make all my fantasy baseball decisions. We crunched our own projections and considered every data point including age, length of contract, trajectory and hardness off the bat…everything. We found that we could not predict the numbers with any certainty because ballplayers are humans and therefore unpredictable.
 After my CBSSports.com life ended in late 2001, Glenn Colton and I began partnering in leagues. Understanding what is going on within each team, each player’s dynamic, their history came into play when we developed the SMART System. It took in to account all the numbers/trends and coupled them with the real-world trends plus over the years we have added in a lot of the higher end numbers to get the full picture of the player and what his value is by applying the numbers and then a set of rules to that evaluation.
My love of the numbers is not a secret in any of my circles. My decades long frustration with the fact that numbers cannot simply be accurate for projections haunts me.
So, after 29 years playing fantasy baseball I came to the conclusion that projections and category targeting are incredibly important to our success in drafting winning fantasy baseball teams, but you need to use them carefully knowing that projections are flawed in many ways. Specifically, (1) the game has changed and projectionists have not caught up; (2) the human element of players can never be included like when a player is traded or a contract year is upon us; (3) upside cannnot be included; (4) hype is often included way too much; (5) many projections are a regurgitation of the previous year's stats with minor changes and most consensus projections look like that. Let's dive in deeper to explain all these disclaimers and show how to use projections and categories!
The Changing Game
One flaw in projections is that they do not consider the changing game. Here are three trends in Major League Baseball that affect what we do for projections: (1) hitters are sacrificing batting average for home runs; (2) more teams are employing defensive tactics like the shift which is lowering batting averages; (3) starting pitchers are throwing less innings because of the individual roles in bullpens that are adopted by almost all MLB teams.
Let’s look at the offense only right now as that is the most projectible and where projections are the most helpful.
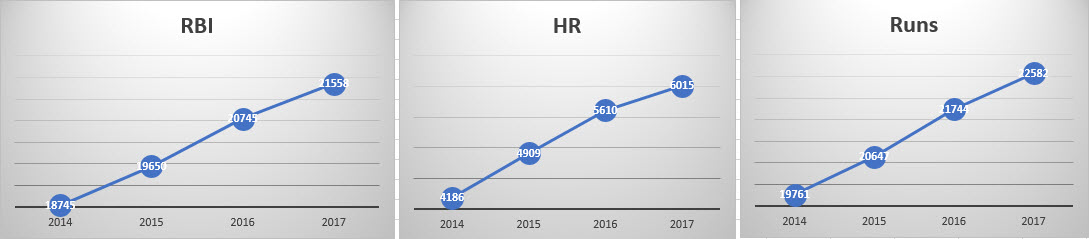

When we take a close look at this, we can see that the counting numbers have gone up dramatically. Strikeouts have risen (that means they have risen for all pitchers combined too). However, stolen bases have gone down and are now more than twice as valuable as home runs. So, when setting up your category targets or looking at projections to see who to take next or to bid on, you need to know that home runs are easier than ever to acquire.
Upside is always lost with projections.
 All projectionists try to come up with the most likely performance of all the players. This causes many to miss on the outliers. Getting more players right means that they will have a wider margin of misses on the high-end and low-end of the spectrum.
For example, my projections last year compared to actuals had the following results for home runs hitters (projection/actual):
- Over 50 Home Runs: 0 / 2
- Over 40 Home Runs: 0 / 5
- Over 30 Home Runs: 15 / 41
- Over 20 Home Runs: 60 / 117
It is just not possible to project the higher home run totals rather than have them all spread out. So be careful that you ALWAYS look for UPSIDE in your picks and then let the projections define your targeting. That way you will always have way more stats than you projections sheet.
Hype and Regurgitation
 No this is not a frat party joke. Players who have not played long in the league can sometimes get overhyped with small sample sizes. Those players projections are skewed by group think. For instance, the group think on Rhys Hoskins is CRAZY. He is being projected for 35-40 home runs in a lot of places. Didn’t anyone ever hear of Kevin Maas or Sean Burroughs? Look them up. They had crazy hype like this. One in ten turns out to be worth the hype and you overpay on nine of them.
Regurgitation is bad. Really bad. Don’t use last year’s stats as your projections for all but new players.
Support Your League Rules
Make sure your projections have the statistics that your league uses. If your league uses holds, make sure you start with projections that have holds. If your league uses quality starts (QS), make sure you start with projections that have QS.
Using Projections for Targeting Players
Now, why are we doing this? Well, it is to learn more about the players that you should target and how to build your roster. Here is how you should use projections to target players:
First, review projections by sorting them by each category that your league uses. Review the players from a lens of them helping your team in that category. Look for players that others or experts are not high on and take down their names. Getting bargains that help you in tough categories like stolen bases are important for you to know about. For instance, as of this writing, David Dahl is projected for 18 stolen bases. This could be helpful from a guy who will come late and in auctions for about $7.
Using Projections for Targeting Categories
 So now we understand the changing game and how to decide on your projections. Now, we connect that to the categories. Remember, knowledge is power.
Here are some rules about setting your category targets:
Don’t Look at Winner for Targets: Look at Top 25% for your target. Finishing in the Top 25% in all categories makes you a winner in your league.
Category dominators: Look at players who are Category dominators and consider them when potentially down against your targets.
Get Ks & SBs from Every Player: When targeting hitters, make sure that you get some.
Don’t Dump Categories: Only the best players can win this way. I am not one of them. Think of myself as top 10%, but it takes an incredible amount of skill and effort both in the draft and in-season. If that is you, then why the heck are you reading my column?
Here is a chart that specifies the targets that I use in the leagues that I play in. Again, you should examine your leagues to see if there are anomalies based on league members dumping categories or playing in a different way then the leagues that I play in.
Category Targets for 2018 | ||||||||||
League Type | Runs | HR | RBI | SB | Avg | W | Sv | K | ERA | WHIP |
15 Team Mixed | 1080 | 320 | 1050 | 130 | 272 | 90 | 80 | 1325 | 3.90 | 1.23 |
12 Team Mixed | 1100 | 330 | 1100 | 130 | 274 | 100 | 90 | 1400 | 3.90 | 1.23 |
10 Team Mixed | 1150 | 350 | 1150 | 130 | 275 | 110 | 100 | 1500 | 3.90 | 1.23 |
12 Team AL Only | 930 | 270 | 910 | 115 | 265 | 82 | 65 | 1200 | 3.90 | 1.23 |
12 Team NL Only | 875 | 235 | 875 | 115 | 270 | 85 | 75 | 1200 | 3.90 | 1.25 |
Using a Tracking Sheet for Projections & Targeting Categories
After all these years, I use some complicated tracking spreadsheets. They are created and augmented year after year, but you can start simple, but just having a sheet with your players and the scoring categories that your league uses. This is a sample tracking sheet from LABR last year:
| P | Lastname | Firstname | $ | Age | B | Pos | Tm | R | HR | RBI | SB | AVG |
| C | Gattis | Evan | 17 | 30 | R | 2 | HOU | 52 | 26 | 67 | 1 | 255 |
| C | Zunino | Mike | 8 | 26 | R | 2 | SEA | 46 | 22 | 60 | 0 | 229 |
| 1B | Abreu | Jose | 27 | 30 | R | 3 | CHW | 78 | 27 | 99 | 1 | 289 |
| MI | Torres | Gleyber | 1 | 24 | L | 8o | CHW | 46 | 4 | 29 | 13 | 236 |
| SS | Semien | Marcus | 17 | 26 | R | 6 | OAK | 71 | 20 | 63 | 11 | 241 |
| 3B | Castellanos | Nick | 18 | 25 | R | 5 | DET | 65 | 23 | 79 | 1 | 267 |
| OF | Valencia | Danny | 8 | 32 | R | 5o9 | SEA | 56 | 16 | 51 | 2 | 268 |
| 2B | Castro | Starlin | 17 | 27 | R | 4 | NYY | 66 | 18 | 76 | 5 | 274 |
| OF | Trout | Mike | 42 | 25 | R | 8o | LAA | 116 | 31 | 95 | 19 | 307 |
| OF | Ellsbury | Jacoby | 15 | 33 | L | 8o | NYY | 67 | 9 | 49 | 17 | 261 |
| CI | Duffy | Matt | 9 | 26 | R | 5 | TAM | 60 | 7 | 53 | 10 | 274 |
| OF | Aoki | Norichika | 2 | 35 | L | o7 | HOU | 57 | 5 | 31 | 13 | 283 |
| OF | Carrera | Ezequiel | 1 | 30 | L | o97 | TOR | 28 | 4 | 17 | 7 | 247 |
| UT | Morales | Kendrys | 17 | 34 | B | 0 | TOR | 68 | 30 | 93 | 0 | 265 |
| TOTALS | 199 | 876 | 242 | 862 | 100 | .266 | ||||||
| Targets | 930 | 270 | 875 | 115 | .265 | |||||||
| P | Last | First | $ | Age | Th | Tm | W | Sv | K | ERA | WHIP | |
| P | Archer | Chris | 25 | 28 | R | TAM | 13 | 0 | 221 | 3.19 | 1.15 | |
| P | Giles | Kenneth | 18 | 26 | R | HOU | 4 | 41 | 84 | 2.95 | 1.19 | |
| P | Duffey | Tyler | 2 | 26 | R | MIN | 9 | 0 | 101 | 4.26 | 1.35 | |
| P | Brach | Brad | 2 | 31 | R | BAL | 8 | 1 | 80 | 2.96 | 1.19 | |
| P | Boyd | Matt | 3 | 26 | L | DET | 9 | 0 | 136 | 4.05 | 1.31 | |
| P | Andriese | Matt | 5 | 27 | R | TAM | 5 | 0 | 78 | 3.62 | 1.24 | |
| P | Gregerson | Luke | 4 | 33 | R | HOU | 4 | 2 | 60 | 3.26 | 1.03 | |
| P | Givens | Mychal | 1 | 27 | R | BAL | 5 | 0 | 88 | 2.96 | 1.16 | |
| P | Norris | Bud | 1 | 32 | R | LAA | 3 | 0 | 75 | 4.55 | 1.46 | |
| TOTALS | 61 | 60 | 44 | 923 | 3.61 | 1.22 | ||||||
| Targets | 82 | 65 | 1200 | 3.90 | 1.23 |
If you are more ambitious, you can use a track sheet that tracks all the teams each in separate by looking up projections when you type players in to the tracking sheet. This allows you to see the whole draft, all at one time and see who is also looking for a statistic. If you reach out to me at rick@fantasyalarm.com, I am glad to share a template for you to start with so you can set the stats look up correctly.
| Lawr | Ambrosius | CTW | |||||||||
| Left to Spend | 0 | Left to Spend | 0 | Left to Spend | 0 | ||||||
| Players Needed | 0 | Players Needed | 0 | Players Needed | 0 | ||||||
| MAX BID | 1 | MAX BID | 1 | MAX BID | 1 | ||||||
| C | Leon | Sandy | 5 | C | Gomes | Yan | 6 | C | Gattis | Evan | 17 |
| C | Phegley | Joshua | 2 | C | Avila | Alex | 1 | C | Zunino | Mike | 8 |
| 1B | Cron | CJ | 12 | 1B | Cabrera | Miguel | 34 | 1B | Abreu | Jose | 27 |
| 2B | Pedroia | Dustin | 18 | 2B | Moncada | Yoan | 14 | MI | Torres | Glamar | 1 |
| SS | Miller | Bradley | 17 | SS | Correa | Carlos | 37 | SS | Semien | Marcus | 17 |
| 3B | Plouffe | Trevor | 13 | 3B | Pinder | Chad | 2 | 3B | Castellanos | Nick | 18 |
| MI | Escobar | Eduardo | 2 | CI | Pujols | Albert | 17 | OF | Valencia | Danny | 8 |
| CI | Refsnyder | Rob | 1 | MI | Lawrie | Brett | 2 | 2B | Castro | Starlin | 17 |
| OF | Springer | George | 27 | OF | Bautista | Jose | 21 | OF | Trout | Mike | 42 |
| OF | Davis | Khristopher | 23 | OF | Trumbo | Mark | 23 | OF | Ellsbury | Jacoby | 15 |
| OF | Calhoun | Kole | 17 | OF | Gomez | Carlos | 18 | CI | Duffy | Matt | 9 |
| OF | Souza | Steven | 10 | OF | Joyce | Matt | 6 | OF | Aoki | Norichika | 2 |
| OF | Maybin | Cameron | 9 | OF | Burns | Billy | 1 | OF | Carrera | Ezequiel | 1 |
| UT | Rasmus | Colby | 6 | UT | Alonzo | Yonder | 3 | UT | Morales | Kendrys | 17 |
| P | Osuna | Roberto | 17 | P | Darvish | Yu | 30 | P | Archer | Chris | 25 |
| P | Sanchez | Aaron | 17 | P | Sale | Chris | 30 | P | Giles | Kenneth | 18 |
| P | Allen | Cody | 15 | P | Ross | Tyson | 2 | P | Duffey | Tyler | 2 |
| P | Madson | Ryan | 5 | P | Giolitto | Lucas | 4 | P | Brach | Brad | 2 |
| P | Snell | Blake | 9 | P | Feliz | Michael | 1 | P | Boyd | Matt | 3 |
| P | Estrada | Marco | 10 | P | Berrios | Jose | 4 | P | Andriese | Matt | 5 |
| P | Pineda | Michael | 11 | P | Sabathia | CC | 2 | P | Gregerson | Luke | 4 |
| P | Zimmermann | Jordan | 5 | P | Lopez | Reynaldo | 1 | P | Givens | Mychal | 1 |
| P | Gray | Sonny | 9 | P | Papelbon | Jonathan | 1 | P | Norris | Bud | 1 |
| Total Hitting | 162 | Total Hitting | 185 | Total Hitting | 199 | ||||||
| Total Pitching | 98 | Total Pitching | 75 | Total Pitching | 61 | ||||||
Nothing replaces your ability to understand what players will do best for your team by watching games, but numbers, specifically projections and some targets for your categories can guide you to having a more balanced team when the draft is over.
Remember, you cannot win the league at the draft, but if you are not watching the numbers, you could lose it.