

Although it's not really advanced analytics, knowing how to mine counting statistics from teams according to batting order helps maximize statistical data while putting together a fantasy roster in draft or auction form. Many focus on where to target stolen bases or home runs, but where a batter resides in the batting order affects his overall valuation. This article explores the impact of batting order, team projections and win futures in an effort to identify enviable targets throughout a draft.
Of course, things can change quickly due to injuries in spring training games. For example, J.T. Realmuto suffering a fracture in his right thumb could impact his power totals in 2021. Staying the course, it's time to delve into the data which many can map out. Players at or near the top of the lineup produce more runs while the heart of the order generates more RBI. Noting the truncated season 2020 provided, here's how each spot in the lineup effected results:
Runs Plus RBI Overview
Starting with the runs category, here's a chart detailing how the 8,344 runs scored in the majors last year occurred by spot in the batting order along with its percentage share:
Lineup Spot | Runs | Percent Share |
Batting 1st | 1,141 | 13.7 |
Batting 2nd | 1,146 | 13.7 |
Batting 3rd | 1,049 | 12.6 |
Batting 4th | 1,013 | 12.1 |
Batting 5th | 904 | 10.8 |
Batting 6th | 818 | 9.8 |
Batting 7th | 750 | 9 |
Batting 8th | 796 | 9.5 |
Batting 9th | 728 | 8.7 |
It's not rocket science seeing the first two spots in the lineup scoring the most runs. However, one needs to note the drop-offs from fifth to sixth and the bottom third of the lineup. Unless it's on a winning team projected to score in the 80th percentile of runs for 2021, staying in the top four-to-five spots in the lineup makes sense. Now for the same chart but with RBI:
Lineup Spot | RBI | Percent Share |
Batting 1st | 776 | 9.7 |
Batting 2nd | 1,021 | 12.8 |
Batting 3rd | 1,011 | 12.7 |
Batting 4th | 1,093 | 13.7 |
Batting 5th | 1,028 | 12.9 |
Batting 6th | 862 | 10.8 |
Batting 7th | 785 | 9.8 |
Batting 8th | 776 | 9.7 |
Batting 9th | 628 | 7.9 |
While lead-off hitters rack up runs, even with the universal designated hitter the RBI total remained below a 10 percent share. This may impact a player like George Springer who produces power but his RBI gets capped by his spot in the lineup. So one needs to make them up elsewhere. Before combining these two categories together, here's some statistical markers in these counting categories to shoot for in 2021:
- 12-team leagues: 80th percentile in 2019 NFBC Online leagues: Runs (1,200), RBI (1,147)
- 15-team leagues: 80th percentile in 2019 NFBC Main Event leagues: Runs (1,149), RBI (1,107)
Using the same premise above, here's how things look by batting spot with these two added together:
Lineup Spot | Runs plus RBI | Percent Share |
Batting 1st | 1,917 | 11.7 |
Batting 2nd | 2,167 | 13.3 |
Batting 3rd | 2.060 | 12.6 |
Batting 4th | 3199 | 12.9 |
Batting 5th | 1,932 | 11.8 |
Batting 6th | 1,680 | 10.3 |
Batting 7th | 1,535 | 9.4 |
Batting 8th | 1,572 | 9.6 |
Batting 9th | 1,356 | 8.3 |
Weighing all of this information, here's how things breakdown by position using the same run and RBI data:
Position | Runs | % Share | RBI | % Share | Runs+RBI | % Share |
Catcher | 732 | 8.8 | 802 | 10 | 1,534 | 9.4 |
1B | 998 | 12 | 1,040 | 13 | 2,038 | 12.5 |
2B | 842 | 10 | 735 | 9.2 | 1,577 | 9.7 |
3B | 908 | 10.9 | 909 | 11.4 | 1,815 | 11.1 |
SS | 971 | 11.6 | 843 | 10.5 | 1,814 | 11.1 |
OF | 2,824 | 33.8 | 2,597 | 32.6 | 5,421 | 33.2 |
DH | 851 | 10.2 | 917 | 11.5 | 1,768 | 10.8 |
PH | 94 | 1.1 | 136 | 1.7 | 230 | 1.4 |
Depending on how many catchers a league requires, getting runs and RBI from them can become difficult. Pay close attention to one's on better teams or in line for a larger share of playing time like Yan Gomes of Washington for instance. Outfielders represent the largest share but this reflects three of them on the field at a time. Thankfully, outfielders present a cornucopia of targets to fill in roster needs throughout a draft. Shortstop projects to be the position to target for middle infielders in 2021 and the results of 2020 back this up in terms of counting statistics.
Runs Plus RBI Top Player Targets
Using results from last year and the last two seasons to identify targets can also benefit those in preparation for an upcoming draft or auction. With deference to the fact 2020 provided a mixed bag of results for fantasy due to the truncated season, along with no in-game video available, here's the top performers in these categories.
Starting with last year, here's the top-10 in runs scored and RBI:
Player | Runs | Player | RBI |
F. Freeman | 51 | J. Abreu | 60 |
F. Tatis Jr. | 50 | M. Ozuna | 56 |
D. Swanson | 49 | F. Freeman | 53 |
M. Betts | 47 | L. Voit | 52 |
T. Turner | 46 | M. Machado | 47 |
R. Acuña Jr. | 46 | J. Ramirez | 46 |
J. Ramirez | 45 | M. Trout | 46 |
T. Anderson | 45 | F. Tatis Jr. | 45 |
M. Machado | 44 | R. Devers | 43 |
J. Abreu | 43 | 5 Players Tied | 42 |
Now adding them together, here's the top 10 in runs plus RBI:
Player | Runs plus RBI Total |
104 | |
103 | |
95 | |
94 | |
93 | |
José Ramirez | 91 |
91 | |
87 | |
87 | |
86 |
It's important to note each player above played on a team which qualified for the expanded play-offs. This will be covered in our last section of research.
In an effort to expand the results, these charts reflect the same categories but from the start of 2019 to see how some values change. Fernando Tatis Jr. drops out since he missed most of the second half last year due to injury. For the purposes of this article, only results from qualified hitters were aggregated.
Last 2 Years Runs plus RBI
Player | Runs | Player | RBI |
M. Betts | 185 | 183 | |
R. Acuña Jr. | 174 | F. Freeman | 177 |
F. Freeman | 164 | A. Rendon | 158 |
R. Devers | 161 | R. Devers | 158 |
C. Bellinger | 155 | P. Alonso | 155 |
T. Story | 154 | M. Trout | 152 |
M. Trout | 153 | J. Soto | 151 |
M. Semien | 151 | E. Rosario | 151 |
J. Soto | 151 | N. Arenado | 149 |
D.J. LeMahieu | 151 | Bellinger/Bogaerts | 148 |
After expanding the results to include the last two years, our last chart takes into account how many runs plus RBI per game as the indicator for ranks. There's some intriguing names and it may be a bit too early to let Mike Trout drift in the first round:
Player | Runs+RBI/Game | Runs+RBI Total | Games played |
1.61 | 305 | 190 | |
1.54 | 341 | 221 | |
1.52 | 305 | 201 | |
1.51 | 302 | 200 | |
1.51 | 265 | 175 | |
Ronald Acuña Jr. | 1.50 | 307 | 205 |
1.48 | 319 | 216 | |
1.47 | 304 | 207 | |
1.46 | 257 | 176 | |
1.42 | 311 | 219 | |
1.41 | 270 | 192 | |
D.J. LeMahieu | 1.41 | 281 | 199 |
1.41 | 273 | 194 |
A case can also be made for Juan Soto as first overall this year, especially if he runs more as he intimated upon his arrival at spring training. Many overlook Eddie Rosario , but he may hit third for Cleveland with José Ramirez ahead of him. For those intrigued, here's Rosario's career spray in Progressive Field since 2015 displaying line drives and fly balls:
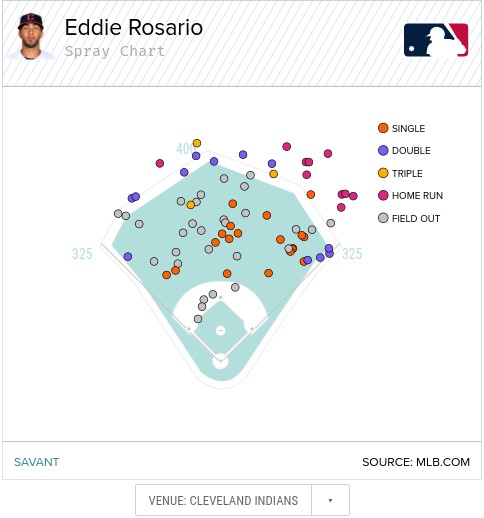
In 177 plate appearances at Progressive Field, Rosario owns a .353/.379/.653 slash with 33 runs, 12 doubles, 11 home runs and 25 RBI in them. Looking to find rebounds at a discount, check out Rafael Devers and Christian Yelich in these categories as well for the season ahead.
2021 Win Projections and Run Projections
Our last step in this process, identify which teams project to win the most games and, of course, score the most runs since counting statistics should ensue. First, here's Fangraphs playoff odds for 2021:
.@fangraphs has announced their projected postseason odds. ????
— MLB (@MLB) February 16, 2021
Let us know what you think ?? pic.twitter.com/1itTsNyf3B
For the gambling crowd, this displays win totals for teams as of this writing for 2021 as well:
Pitchers and catchers report to Spring Training this week! ?? #MLB Win totals are now posted at https://t.co/TLpglIgEm8 in @SuperBookCO & @SuperBookNV pic.twitter.com/1avcb1vQHa
— SuperBook Sports (@SuperBookSports) February 16, 2021
Trying to get the top batters of the Dodgers (103.5 win total), Yankees (95.5 win total), Padres (93.5 win total), Braves (90.5 win total) and Mets (90.5 win total) makes sense. Of course, as the next part shows, different projection systems foresee different run totals for the top and bottom teams.
First, the top five in THE BAT X projections for runs by team:
- Dodgers: 915 runs
- Phillies: 880 runs
- Yankees: 870 runs
- Blue Jays: 861 runs
- Braves: 856 runs
And according to ATC projections:
- Yankees: 949 runs
- Blue Jays: 888 runs
- Dodgers: 883 runs
- Braves: 869 runs
- Mets: 858 runs
Using Fangraphs playoffs odds, the following teams own less than a projected two percent chance:
- Orioles
- Tigers
- Rangers
- Mariners
- Rockies
- Pirates
- Marlins
If taking players on these teams, be sure to target the top spots in the lineups to maximize their counting statistics. There's still runs to be scored by bad teams, just monitor where your target projects to hit.
Hopefully this clarifies the process to identify how to use batting order and teams to build an optimal roster for runs and RBI. There are many pieces to the puzzle when building a roster's foundation but using the tenets from above, leave your league in the dust while hitting your percentile en route to flying the flag at the end of the season.
---------------------------------------------------------------------------------------------------------
Statistical Credits:
Fangraphs.com
BaseballSavant.com
Baseball-Reference.com
THE BAT X courtesy of Derek Carty
ATC courtesy of Ariel Cohe