

| Age: | 24 |
| Bats/Throws: | R/R |
| Height/Weight: | 6'2", 190 lbs |
| Position: | Outfield |
Can there be a tangible price on possibilities? Seems like Byron Buxton teases fantasy owners each year with the chance this will be the one he breaks out. He started slowly in 2016 but his power surge in September lured owners in for 2017. During the first half, Buxton disappointed once again but surged in the second half displaying his tantalizing skill set. Although he’s seemingly on the precipice of great things entering his Age-24 season, will Buxton finally take the quantum leap fantasy players desire?
Starting with league metrics, weighted runs created plus measures productivity with 100 representative of league average. Buxton’s yet to produce a season above this mark but it will cost a top-50 pick in snake drafts to roster him. Of course, with many owners banking on his stolen base upside, speculation may be warranted due to perceived scarcity. Buxton’s never played more than 140 games (his total last year) in the majors nor reached 150 or more games combining his minor league and major league totals the past three seasons. Depreciating a player due to an injury prone label proves risky, see Giancarlo Stanton last year, but it does play a part in his overall profile.
Buxton’s coming off of his most productive season for fantasy purposes last year after appearing in 140 games with the Twins. He slashed .253/.314/.413 with 69 runs, 16 home runs, 51 RBI and 29 stolen bases. Comparing his numbers to his expected statistics courtesy of xSTATS, Buxton’s numbers come close. According to xSTATS, Buxton’s slash of .246/.307/.407 does not stray too much from his numbers above along with 16.1 expected home runs. Even his expected on-base average and batting average on balls in play align with his actual numbers. So in regards to Buxton’s slash line, it’s reasonable to repeat, but will there be growth? His current price tag seems to demand it. There’s a difference between a floor and a high floor in statistics.
Part of Buxton’s appeal lies within the stolen bases. He swiped 29 in 30 attempts last season, providing hope for more within his average draft position. There’s no way to tell how aggressive Buxton will be if he hits sixth as Roster Resource projects him and where he’s hit over the last few games in spring. Buxton only accrued 32 at-bats batting sixth last year with nine runs, a home run, five RBI and one stolen base. Far too small of a sample to extract statistics from. As for the Twins, the cumulative total of statistics from the sixth spot in the lineup produced 605 at-bats, 80 runs, 22 home runs, 77 RBI, eight stolen bases and a .238/.307/.398 slash line. On the surface, Buxton’s an upgrade. But will he run?
Regarding his power, the metrics seem to be all over the place. Buxton’s hit 17 of his 26 home runs the last two years in two months. During his hot September of 2016 and in August of last year, Buxton totaled the number above in only 206 at-bats or one every 12.1 at-bats during these surges. However, his other 554 at-bats the last year yields only nine home runs for a much less appealing home run every 61.6 at-bats. Whether Buxton’s streaky or developing his power remains a question mark.
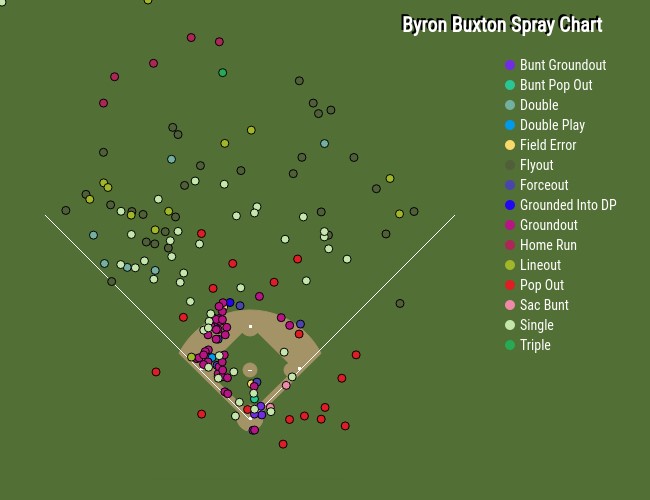
For a frame of reference, here’s Buxton’s first half spray chart from last year during which he hit five home runs in 255 at-bats and slashed .216/.288/.306:
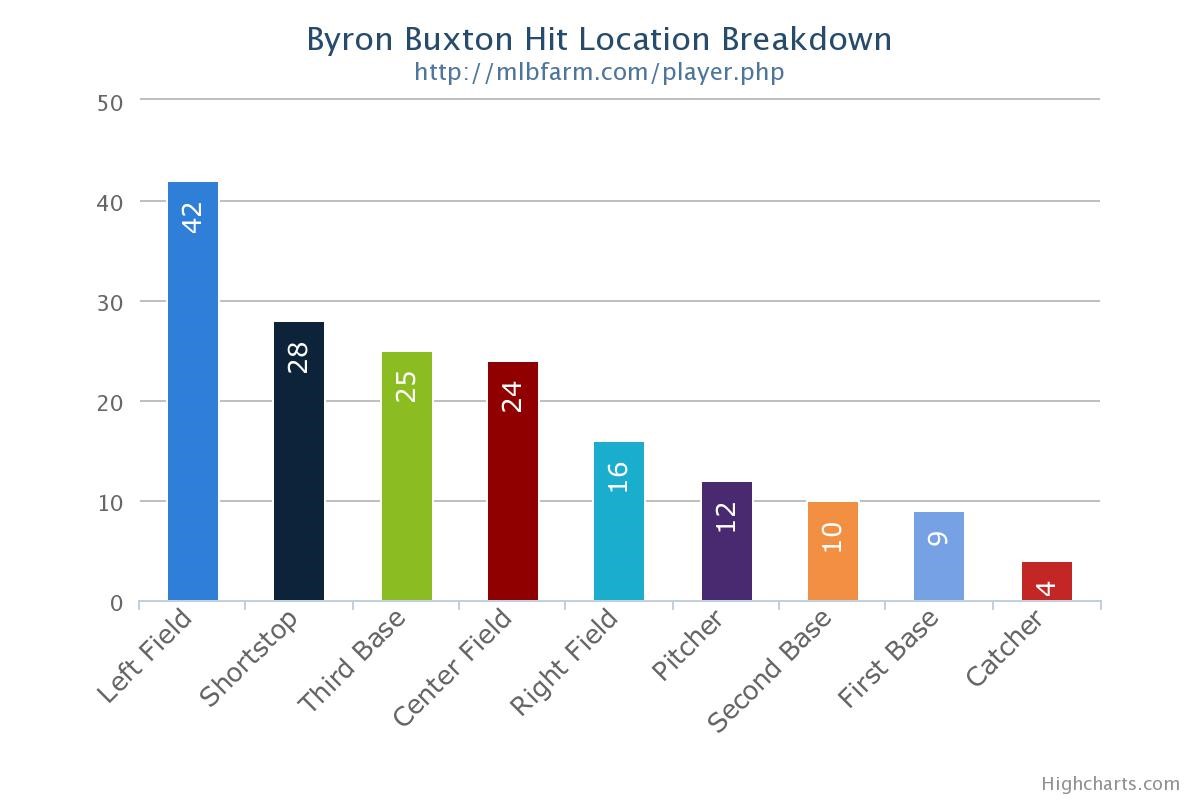
And, take note of how he struggles at the plate when he closes off the middle and right side of the field by looking at his hit location chart courtesy of MLBfarm.com:
During the second half, Buxton caught fire with a .300/.347/.546 which seems to resonate with fantasy owners looking for the upside which exists, but only in small samples with Buxton. Here’s his spray chart after the All-Star break:
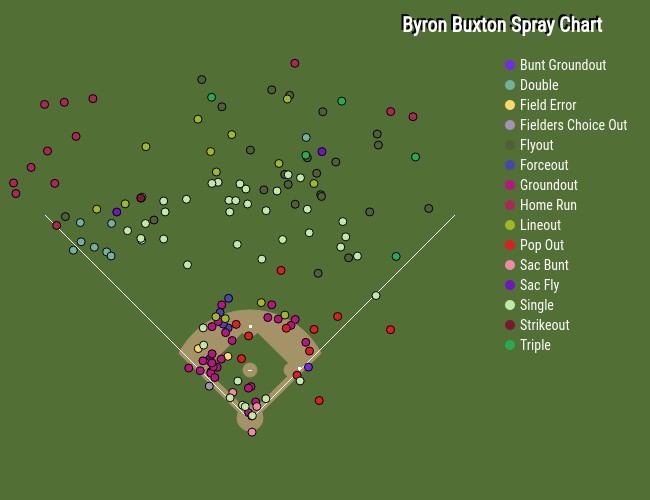
Although Buxton only hit three home runs to the middle or right side, note the difference in his hit location chart which seemed to translate to his second half success:

It seems like Buxton needs to use the whole field in order to hit for higher average, and support his power. However, it’s still speculative.
Shifting to his plate discipline and batted ball data, Buxton’s a work in progress. He can get on base, but only 31.4 percent of the time last year. Buxton did cut his swinging strike percentage from 15 in 2016 to 13.1 last season along with increasing his contact by just under four percent, but there’s more work to be done to raise his average to provide a return on his current investment cost. His hard hit percentage basically repeated in both seasons and overall, his home runs per at-bat rate sits in the one every 29 range.
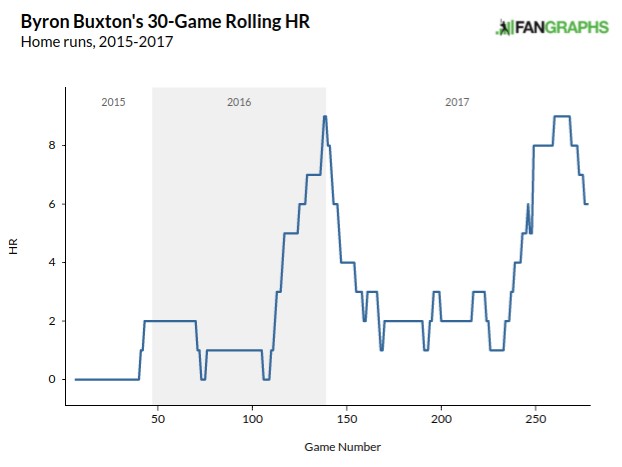
In an effort to see if there’s any correlation to be made in his underlying data to predict outcomes, here’s Buxton’s weighted on-base average, home run per fly ball percentage, strikeout and pull rates in a 30-game rolling chart from Fangraphs:

At the end of 2016 through his start to last year, Buxton did see a rise in his pull percentage with varying results. He surged in power in September of 2016, but struggled in the first half of last season. It’s nice to see his strikeout percentage decreasing, but it still hovers between 25-to-30 percent which can be less than ideal and lends to his streakiness. There’s still much to learn about Buxton as he continues to evolve as a major league hitter, which this graph fully endorses.
However, when perusing Buxton’s projections, they seem to bake in a more aggressive rates for power while being cautious in regards to his speed. For the purposes of this article, a poll ran for four hours with Buxton reaching 30 steals or more winning by a landslide in terms of his possible outcomes this year. Coming in second, a 20 home run and 30 stolen base season, in third, 20 or more home runs and hitting .265 or higher in a distant last place. Here’s Buxton’s projections using four systems listed on Fangraphs:
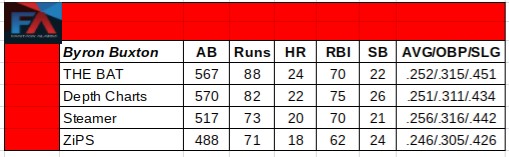
Derek Carty’s THE BAT seems the most aggressive in terms of runs and home runs, but wary of last year’s spike in steals by Buxton. When looking at present average draft position, paying this price on Buxton compared to a Christian Yelich, it’s risky. Eight players last year reached at least 20 home runs and 20 stolen bases, so this explains the appeal of targeting a player like Buxton. Only Jose Altuve hit at least 20 homers and stole 30 last year, so it’s an exclusive club of late.
There’s plenty of room for growth in Byron Buxton as a fantasy commodity. Whether it comes to fruition in 2018 remains to be seen. As for the price to find out, it’s steep. Keep in mind the expected slash lines from last year along with Buxton’s volatility in power.
There’s a career year lying in wait, but keep it more in the Devon White (career .263/.319/.419) range for now. Buxton’s counting statistics could depend on where he hits all season so use the baseline provided above of the Twins sixth hitters to arrive at an accurate expectation of runs and RBI. Pay for 19 home runs and 27 stolen bases, hope for White’s 24 home run, 32 stolen base career best from 1987, it’s more hope right now than expectation for Buxton. But this allure sets the market.
----------------------------------------------------------------------------------------------------------------------
Statistical Credits:
Fangraphs.com, MLBfarm.com, xSTATS.org, THE BAT - Derek Carty, Steamerprojections.com, ZiPS courtesy of Dan Szymborski, RosterResource.com