
One theme that has emerged in the Managerial Tendencies series this year is that a single managerial decision can have both positive and negative impacts from a fantasy perspective.
As an example, last week we talked about platooning. While platooning can get hitters a higher percentage of plate appearances with the platoon advantage, it also results in players getting less plate appearances overall. If you’re in a shallow fantasy league, you want everyday players who can crack 600 PA in a season. But if you’re in a deeper league, guys getting 300-400 PA in a season are playable, so you’d prefer that hitters come to plate with the platoon advantage more often.
This week we’ll turn our attention to pitching and look at how long managers have been leaving their starters in games this season. The same give and take exists here. Leaving a starter in the game longer allows them the chance to strike more batters out and have a better chance of being the pitcher of record and recording a win (or a quality start). But leaving them in also subjects them to risk in the ratio categories as pitchers fare worse on average each additional time through the lineup.
There is no doubt that talent affects how long a manager leaves his starters in games. For example, the Cardinals have the best rotation ERA in the league so far, and their pitchers have the fourth highest average number of pitches thrown per start. There’s not much to be gleaned about what Mike Matheny is doing with his staff. They have pitched well so he has let them continue to pitch. But we can identify some fantasy relevant information when we see a team with an average number of pitches thrown per start that doesn’t jive with the quality of the pitching.
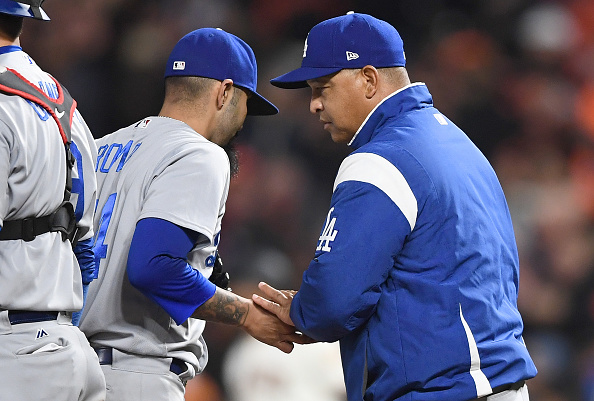
Dave Roberts - Los Angeles Dodgers
The five teams with the lowest average number of pitches thrown per start have team ERAs of 5.74, 5.14, 4.95, 4.71 and 3.48. One of these is clearly not like the others. That 3.48 ERA belongs to LA’s rotation and is the third lowest staff ERA in the league. Despite their success, LA’s starters have the fourth lowest average number of pitches thrown per start with 87.1.
A few Rich Hill early exits due to blisters are probably skewing the numbers a bit, but every non-Kershaw LA starter is averaging less than 90 pitches per start when the league average is 93.6. As mentioned, starters see their numbers go up on average every time through the lineup, so Roberts’ quicker hook is likely contributing to LA’s low staff ERA to some degree.
The fantasy takeaway from how LA handles their staff is that Dodger starters are good names to consider if you’re looking for help in the ratio categories. Brandon McCarthy and Kenta Maeda are likely owned in all but some shallow leagues, but they’re good ratio guys if you need help there. McCarthy has a 3.28 ERA with a 3.48 xFIP to back it up and a 1.09 WHIP. Maeda’s ERA is up at 5.08 because he has struggled with the long ball, but his strikeout and walk numbers are excellent and his xFIP is a solid 3.88. And Maeda’s 1.24 WHIP is still well below the starter average of 1.33.

Another team that falls into the same category as the Dodgers is the Astros. Houston has the second lowest staff ERA, but A.J. Hinch’s starters have an average number of pitches per start that is right at the league average.
Houston is also like in LA in that their top two pitchers are owned in basically all leagues, but their 3-4 starters are available in plenty of leagues. In fact, Brad Peacock and Joe Musgrove have ESPN ownership percentages that are in single digits, so they’re going to be available in more shallow leagues than McCarthy and Maeda, but their real utility is in deeper leagues. Be warned that Musgrove gives up hits at a high rate and Peacock struggles with walks, but Hinch has shown he’s not going to hang them out to dry and let them, and your ratios, take a beating.
Brad Ausmus – Detroit Tigers
The Tigers rotation has been below average so far this season with the 12th highest ERA in the league and the eighth highest xFIP. And yet the Tigers staff is averaging the second highest number of pitches per start with 99.9 pitches per start, trailing only the Nationals.
If you’re looking for strikeouts and can afford some ratio risk, you want a starter to go out and throw 100 pitches and rack up as many Ks as he can. On average, Ausmus is going to give you that from a starter. He gave you exactly that on Saturday when Buck Farmer made a spot start, threw 103 pitches and struck out 11 White Sox. If and when Farmer gets called back up, he’s a name to keep in mind for strikeouts. He has a 23.8 percent strikeout rate in nine Triple-A starts this season.
Justin Verlander and Michael Fulmer are owned in all leagues, and Jordan Zimmermann and Matt Boyd have below average strikeout numbers. But Daniel Norris has a strikeout rate near league average and had a healthy 23.5 percent strikeout rate in 13 starts last season. He’s another option to add or stream if you’re looking for strikeouts.
Other teams with bad staff ERAs that have a high average number of pitches per start anyway are Buck Showalter’s Orioles and Bruce Bochy’s Giants. Wade Miley has an above average 21.6 percent strikeout rate for the O’s, and Matt Moore’s strikeout rate is just a shade below average for the Giants. Both guys have ownership rates around 30 percent, so they’re widely available in shallow leagues and should even have some availability in moderately deeper leagues.
Ausmus’, Showalter’s and Bochy’s stubbornness about leaving their starters in is contributing in some part to the high ERAs their rotations have, but that doesn’t make it an outright bad thing from a fantasy perspective. They’ll let those pitch counts get up which helps us raise our numbers in counting categories.