For the second time this season, we get to say “IT’S BRISTOL BABY!!” The Last Great Colosseum is playing host to the Bass Pro Shops Night Race this Saturday night for 500 laps of pure beating and banging madness. Bristol races are already nuts to begin with, but now it’s the last race of the first round of the playoffs and so things will be heightened to an even greater level.
Bristol is a unique track among short tracks because it is a high-banked, concrete, half-mile track that generally has two racing grooves in it, when they put down the PJ1 traction compound like they are this weekend, and it is considered the fastest of the short tracks. The high speeds and close confines mean that accidents tend to happen at a high rate here, just look back at May’s race, and they can involve a few drivers in each one since there really isn’t a way to avoid them.
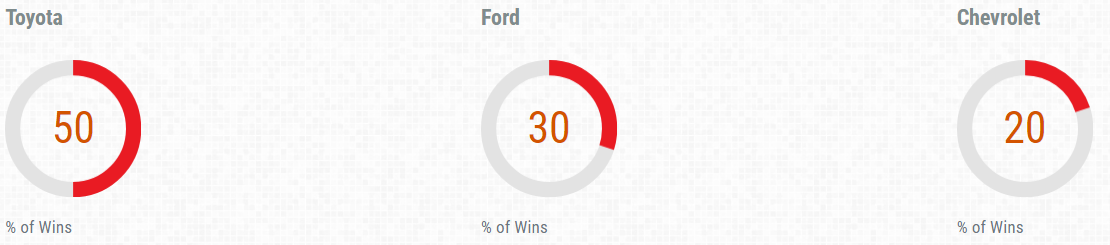
With Kyle Busch and Denny Hamlin winning here recently, Toyota has the lead in terms of manufacturer performance here over the last 10 races.
| From the Pole | 22.5% | 27 |
| From the Front Row | 33.3% | 40 |
| From the Top-5 | 56.7% | 68 |
| From the Top-10 | 77.5% | 93 |
| From the Top-15 | 89.2% | 107 |
| From Outside the Top-20 | 5.8% | 7 |
| Out of: 120 |
Starting up front is preferable here, just like most short tracks but the pole position isn't quite as dominant as others.
What isn’t unique to short tracks is just how fast the laps led can rack up here as it’s hard to pass for the lead and with laps being completed every 15 seconds or so, a driver can hit triple-digits pretty easily. With 500 laps on tap on Saturday, dominator points will be huge here, and expect high scores for the cash lines on both sites in both formats. On FanDuel for example, if all five of your drivers finish 500 laps, that’s 250 points in laps completed right there and if you have let’s say 400 laps led in that lineup, that’s another 40 points before we even factor in the finish positions or position differential. The strategy here is to expect crashes and hope your drivers aren’t the ones involved and you get as many laps led as possible.
Core Drivers By Tier
Tier 1 - Brad Keselowski
Keselowski is on the pole for this race and the pole position has been quite beneficial to have at Bristol of late.
He won the race here in May (because the two cars in front crashed on the last restart) but was in the right spot at the right time and was on the pole for that race too.
He’s top-five in dominator points over the last four races which adds to his value in this tier.
Tier 2 - Clint Bowyer
This is Bowyer’s best track statistically and he keeps backing that up each race.
He’s finished no worse than P8 in eight of the last 10 races here including five straight
Bowyer is very close to the cutline so he needs a great showing on Saturday to advance
Tier 3 - Ryan Newman
Solid finishes are needed here and this tier is a great place to find them with Newman.
He’s finished top-15 in the last four races here and has nearly five spots of PD a race
Going back through the last 10 races here he has nine top-15 finishes including five top-10s
Contrarian Play - Bubba Wallace
The typical logic here is to not start someone too far back as they could get lapped quickly.
Wallace however, is used to starting back here with a 28.3 average start in the last four races.
He’s turned that start into a 20.5 average finish with three top-20s with a top-10.
Fade - Aric Almirola
Almirola has the pressure on him this week as he’s just above the cutline for the next round.
That pressure is mounting when you consider his track history here and not finishing better than P29 in the last five races despite solid starting spots in most of them
It’s not just recently either, he’s raced here 22 times in the Cup series and it’s his worst track by average finish at 25.0 with just nine top-20s in that span.
Last Four Bristol Races
Tier 1
| | | | Avg. | Run. | Avg. | Pos. | | | | |
| Driver | Team | # | Start | Pos. | Finish | Diff. | 1-5 | 6-10 | 11-15 | 16-20 |
| Denny Hamlin | JGR | 4 | 5.8 | 9.8 | 9.3 | -3.5 | 2 | 0 | 1 | 1 |
| Kevin Harvick | SHR | 4 | 8.8 | 16.7 | 18.3 | -9.5 | 0 | 1 | 2 | 0 |
| Brad Keselowski | Penske | 4 | 9.3 | 8.3 | 9.5 | -0.2 | 2 | 0 | 0 | 2 |
| Chase Elliott | Hendrick | 4 | 3.8 | 5.2 | 10.3 | -6.5 | 2 | 0 | 1 | 0 |
| Kyle Busch | JGR | 4 | 14.5 | 11.6 | 7.3 | 7.2 | 3 | 0 | 0 | 1 |
| Martin Truex Jr | JGR | 4 | 12 | 12 | 20 | -8 | 0 | 0 | 1 | 2 |
| Joey Logano | Penske | 4 | 10 | 8.9 | 11 | -1 | 2 | 0 | 0 | 1 |
| | | LL | FL | Dominator | Top-15 | QP | Avg. | LC |
| Driver | # | /Race | /Race | Pts./ Race | Rate | /Race | Rating | /Race |
| Denny Hamlin | 4 | 54.3 | 18.0 | 22.6 | 0.9 | 64.0 | 97.8 | 500.0 |
| Kevin Harvick | 4 | 9.0 | 46.0 | 25.3 | 0.5 | 33.3 | 88.7 | 436.0 |
| Brad Keselowski | 4 | 61.5 | 27.8 | 29.3 | 0.9 | 57.5 | 101.5 | 499.5 |
| Chase Elliott | 4 | 67.8 | 32.0 | 32.9 | 1.0 | 53.3 | 112.0 | 500.0 |
| Kyle Busch | 4 | 50.3 | 43.5 | 34.3 | 0.7 | 40.5 | 105.0 | 499.3 |
| Martin Truex Jr | 4 | 13.0 | 30.8 | 18.6 | 0.7 | 42.8 | 89.4 | 482.0 |
| Joey Logano | 4 | 60.8 | 30.5 | 30.4 | 0.8 | 55.8 | 101.8 | 499.3 |
Tier 2
| | | | Avg. | Run. | Avg. | Pos. | | | | |
| Driver | Team | # | Start | Pos. | Finish | Diff. | 1-5 | 6-10 | 11-15 | 16-20 |
| Erik Jones | JGR | 4 | 10.5 | 12 | 14 | -3.5 | 2 | 0 | 0 | 0 |
| Kurt Busch | Ganassi | 4 | 13 | 11.2 | 4.8 | 8.2 | 2 | 2 | 0 | 0 |
| Ryan Blaney | Penske | 4 | 7.3 | 10.7 | 15.3 | -8 | 1 | 2 | 0 | 0 |
| Jimmie Johnson | Hendrick | 4 | 19.3 | 12.6 | 10.3 | 9 | 1 | 2 | 0 | 1 |
| Clint Bowyer | SHR | 4 | 16.8 | 8.5 | 5.5 | 11.3 | 1 | 3 | 0 | 0 |
| Aric Almirola | SHR | 4 | 5.3 | 20.5 | 31.5 | -26.2 | 0 | 0 | 0 | 0 |
| Matt DiBenedetto | Wood Bros. | 4 | 16.5 | 17 | 16.8 | -0.3 | 1 | 0 | 1 | 0 |
| William Byron | Hendrick | 4 | 10.3 | 17.5 | 17 | -6.7 | 0 | 1 | 0 | 1 |
| Austin Dillon | RCR | 4 | 18 | 18.9 | 16.8 | 1.2 | 0 | 1 | 2 | 0 |
| | | LL | FL | Dominator | Top-15 | QP | Avg. | LC |
| Driver | # | /Race | /Race | Pts./ Race | Rate | /Race | Rating | /Race |
| Erik Jones | 4 | 8.3 | 22.8 | 13.4 | 0.7 | 55.8 | 89.0 | 498.0 |
| Kurt Busch | 4 | 8.3 | 13.8 | 8.9 | 0.7 | 48.5 | 95.5 | 499.8 |
| Ryan Blaney | 4 | 84.8 | 26.0 | 34.2 | 0.8 | 43.8 | 104.6 | 424.5 |
| Jimmie Johnson | 4 | 0.0 | 8.3 | 4.1 | 0.7 | 59.0 | 89.0 | 499.0 |
| Clint Bowyer | 4 | 36.0 | 24.5 | 21.3 | 0.9 | 65.3 | 104.6 | 500.0 |
| Aric Almirola | 4 | 0.5 | 12.5 | 6.4 | 0.5 | 37.5 | 68.3 | 345.8 |
| Matt DiBenedetto | 4 | 24.3 | 9.5 | 10.8 | 0.5 | 31.8 | 78.0 | 488.0 |
| William Byron | 4 | 0.0 | 6.0 | 3.0 | 0.3 | 30.8 | 69.2 | 498.0 |
| Austin Dillon | 4 | 0.0 | 1.5 | 0.8 | 0.5 | 36.8 | 71.3 | 471.8 |
Tier 3
| | | | Avg. | Run. | Avg. | Pos. | | | | |
| Driver | Team | # | Start | Pos. | Finish | Diff. | 1-5 | 6-10 | 11-15 | 16-20 |
| Ricky Stenhouse Jr | JTG | 4 | 15.5 | 23.9 | 31 | -15.5 | 0 | 0 | 0 | 0 |
| Alex Bowman | Hendrick | 4 | 14.3 | 20.1 | 20.8 | -6.5 | 0 | 1 | 1 | 0 |
| Ryan Newman | Roush | 4 | 16.5 | 14.4 | 11.8 | 4.7 | 0 | 1 | 3 | 0 |
| Cole Custer | SHR | 1 | 22 | 28.6 | 35 | -13 | 0 | 0 | 0 | 0 |
| Bubba Wallace | Petty | 4 | 28.3 | 22.9 | 20.5 | 7.8 | 0 | 1 | 1 | 1 |
| Tyler Reddick | RCR | 1 | 21 | 31 | 36 | -15 | 0 | 0 | 0 | 0 |
| John H. Nemechek | Front Row | 1 | 18 | 15.9 | 13 | 5 | 0 | 0 | 1 | 0 |
| Matt Kenseth | Ganassi | 1 | 14 | 13.9 | 16 | -2 | 0 | 0 | 0 | 1 |
| Ty Dillon | Germain | 4 | 27.3 | 23.2 | 23.8 | 3.5 | 0 | 0 | 1 | 1 |
| Chris Buescher | Roush | 4 | 25.3 | 17.8 | 20.3 | 5 | 0 | 0 | 0 | 2 |
| Ryan Preece | JTG | 3 | 28.7 | 23.9 | 18.3 | 10.4 | 0 | 0 | 1 | 1 |
| Daniel Suarez | Gaunt | 4 | 24 | 17.4 | 13 | 11 | 0 | 2 | 0 | 2 |
| | | LL | FL | Dominator | Top-15 | QP | Avg. | LC |
| Driver | # | /Race | /Race | Pts./ Race | Rate | /Race | Rating | /Race |
| Ricky Stenhouse Jr | 4 | 0.0 | 11.3 | 5.6 | 0.3 | 28.3 | 61.2 | 377 |
| Alex Bowman | 4 | 0.0 | 5.0 | 2.5 | 0.4 | 37.5 | 69.0 | 431 |
| Ryan Newman | 4 | 0.3 | 1.3 | 0.7 | 0.6 | 51.8 | 78.7 | 500 |
| Cole Custer | 1 | 0.0 | 0.0 | 0.0 | 0.0 | 1.0 | 43.7 | 228 |
| Bubba Wallace | 4 | 0.0 | 0.0 | 0.0 | 0.2 | 6.5 | 56.3 | 375 |
| Tyler Reddick | 1 | 0.0 | 0.0 | 0.0 | 0.0 | 0.0 | 37.0 | 228 |
| John H. Nemechek | 1 | 0.0 | 0.0 | 0.0 | 0.0 | 0.0 | 76.3 | 0 |
| Matt Kenseth | 1 | 0.0 | 10.0 | 5.0 | 0.6 | 71.0 | 79.6 | 500 |
| Ty Dillon | 4 | 1.5 | 0.5 | 0.6 | 0.2 | 19.3 | 56.1 | 423 |
| Chris Buescher | 4 | 0.0 | 1.8 | 0.9 | 0.4 | 27.3 | 65.8 | 498 |
| Ryan Preece | 3 | 0.0 | 0.7 | 0.3 | 0.0 | 1.7 | 56.6 | 498 |
| Daniel Suarez | 4 | 0.0 | 7.8 | 3.9 | 0.4 | 39.8 | 75.0 | 500 |
Tier 4
| | | | Avg. | Run. | Avg. | Pos. | | | | |
| Driver | Team | # | Start | Pos. | Finish | Diff. | 1-5 | 6-10 | 11-15 | 16-20 |
| Michael McDowell | Front Row | 4 | 25.5 | 27.9 | 29 | -3.5 | 0 | 0 | 1 | 0 |
| Corey Lajoie | Go Fas | 4 | 30 | 28.2 | 31 | -1 | 0 | 0 | 0 | 0 |
| Garrett Smithley | McLeod | 1 | 31 | 33.3 | 26 | 5 | 0 | 0 | 0 | 0 |
| Timmy Hill | MBM | 3 | 36.7 | 30.7 | 27.3 | 9.4 | 0 | 0 | 0 | 1 |
| Gray Gaulding | Rick Ware | 3 | 33.7 | 32.8 | 35.3 | -1.6 | 0 | 0 | 0 | 0 |
| Reed Sorenson | Spire | 2 | 36.5 | 33.6 | 35.5 | 1 | 0 | 0 | 0 | 0 |
| Joey Gase | PWR | 1 | 27 | 36 | 33 | -6 | 0 | 0 | 0 | 0 |
| Josh Bilicki | TBR | 1 | 35 | 32.9 | 35 | 0 | 0 | 0 | 0 | 0 |
| James Davison | Rick Ware | | | | | | | | | |
| Brennan Poole | Premium | 1 | 34 | 29.8 | 24 | 10 | 0 | 0 | 0 | 0 |
| | | LL | FL | Dominator | Top-15 | QP | Avg. | LC |
| Driver | # | /Race | /Race | Pts./ Race | Rate | /Race | Rating | /Race |
| Michael McDowell | 4 | 0.0 | 0.3 | 0.1 | 0.0 | 4.0 | 46.3 | 343 |
| Corey Lajoie | 4 | 0.0 | 0.3 | 0.1 | 0.0 | 3.0 | 43.7 | 353 |
| Garrett Smithley | 1 | 0.0 | 1.0 | 0.5 | 0.0 | 0.0 | 36.4 | 489 |
| Timmy Hill | 3 | 0.0 | 0.0 | 0.0 | 0.0 | 0.0 | 39.6 | 327 |
| Gray Gaulding | 3 | 0.0 | 0.0 | 0.0 | 0.0 | 0.0 | 34.0 | 200 |
| Reed Sorenson | 2 | 0.0 | 0.0 | 0.0 | 0.0 | 0.0 | 34.7 | 304 |
| Joey Gase | 1 | 0.0 | 1.0 | 0.5 | 0.0 | 0.0 | 30.6 | 302 |
| Josh Bilicki | 1 | 0.0 | 0.0 | 0.0 | 0.0 | 0.0 | 34.2 | 373 |
| James Davison | | | | 0.0 | | | | |
| Brennan Poole | 1 | 0.0 | 1.0 | 0.5 | 0.0 | 0.0 | 44.7 | 494 |
Top-20 Drivers Over Last 8 Bristol Races
| | | Avg. | Run. | Avg. | Pos. | | | | |
| Driver | # | Start | Pos. | Finish | Diff. | 1-5 | 6-10 | 11-15 | 16-20 |
| Kyle Busch | 8 | 10.9 | 10.3 | 13.1 | -2.2 | 5 | 0 | 0 | 1 |
| Denny Hamlin | 8 | 9.1 | 9.3 | 8.4 | 0.7 | 4 | 1 | 2 | 1 |
| Jimmie Johnson | 8 | 17.8 | 11 | 7.9 | 9.9 | 3 | 3 | 1 | 1 |
| Joey Logano | 8 | 9.1 | 8.9 | 10.1 | -1 | 3 | 2 | 1 | 1 |
| Kurt Busch | 8 | 13.5 | 15.5 | 13.6 | -0.1 | 3 | 2 | 0 | 0 |
| Erik Jones | 7 | 10 | 10.9 | 14.4 | -4.4 | 3 | 0 | 0 | 1 |
| Clint Bowyer | 8 | 16.3 | 13 | 10.3 | 6 | 2 | 4 | 0 | 1 |
| Kevin Harvick | 8 | 17.1 | 12.5 | 11.5 | 5.6 | 2 | 3 | 2 | 0 |
| Chase Elliott | 8 | 5.4 | 9.8 | 13.8 | -8.4 | 2 | 1 | 2 | 1 |
| Ricky Stenhouse Jr | 8 | 15.5 | 19.3 | 19.1 | -3.6 | 2 | 1 | 1 | 0 |
| | | Avg. | Run. | Avg. | Pos. | | | | |
| Driver | # | Start | Pos. | Finish | Diff. | 1-5 | 6-10 | 11-15 | 16-20 |
| Matt Kenseth | 4 | 11.5 | 13.3 | 15.3 | -3.8 | 2 | 0 | 0 | 1 |
| Brad Keselowski | 8 | 8.8 | 14 | 19.6 | -10.8 | 2 | 0 | 0 | 2 |
| Ryan Blaney | 8 | 6.8 | 12.3 | 21.8 | -15 | 1 | 3 | 0 | 0 |
| Austin Dillon | 8 | 17.9 | 18.3 | 17.3 | 0.6 | 1 | 1 | 4 | 0 |
| Alex Bowman | 5 | 13 | 18 | 17.6 | -4.6 | 1 | 1 | 1 | 0 |
| Matt DiBenedetto | 8 | 21.8 | 21 | 18.8 | 3 | 1 | 0 | 1 | 2 |
| Chris Buescher | 8 | 22.1 | 21.7 | 23.5 | -1.4 | 1 | 0 | 0 | 2 |
| Ryan Newman | 8 | 17.1 | 14.4 | 13.1 | 4 | 0 | 3 | 4 | 0 |
| Daniel Suarez | 7 | 20.4 | 16.5 | 13.7 | 6.7 | 0 | 2 | 2 | 3 |
| Martin Truex Jr | 8 | 11.3 | 13.5 | 20.3 | -9 | 0 | 1 | 1 | 2 |
| | | LL | FL | Dominator | LC | Avg. |
| Driver | # | /Race | /Race | Pts/ Race | /Race | Rating |
| Kyle Busch | 8 | 91.3 | 50.3 | 48.0 | 467.1 | 109 |
| Denny Hamlin | 8 | 31.3 | 18.0 | 16.8 | 499.9 | 101.2 |
| Jimmie Johnson | 8 | 10.1 | 16.0 | 10.5 | 499.5 | 95.8 |
| Joey Logano | 8 | 44.3 | 21.8 | 22.0 | 499.6 | 99.8 |
| Kurt Busch | 8 | 4.1 | 9.3 | 5.7 | 482.6 | 84.3 |
| Erik Jones | 7 | 41.9 | 25.6 | 23.3 | 497.9 | 94.5 |
| Clint Bowyer | 8 | 18.0 | 14.1 | 11.6 | 496.1 | 88.1 |
| Kevin Harvick | 8 | 22.3 | 39.4 | 25.3 | 468.0 | 97.9 |
| Chase Elliott | 8 | 35.9 | 22.6 | 20.3 | 496.5 | 96.9 |
| Ricky Stenhouse Jr | 8 | 0.0 | 15.3 | 7.7 | 438.6 | 74.4 |
| | | LL | FL | Dominator | LC | Avg. |
| Driver | # | /Race | /Race | Pts/ Race | /Race | Rating |
| Matt Kenseth | 4 | 2.8 | 13.3 | 7.4 | 468.3 | 86.5 |
| Brad Keselowski | 8 | 39.1 | 20.0 | 19.8 | 484.6 | 84.6 |
| Ryan Blaney | 8 | 54.9 | 19.9 | 23.7 | 400.5 | 92.9 |
| Austin Dillon | 8 | 0.0 | 2.1 | 1.1 | 452.0 | 71.7 |
| Alex Bowman | 5 | 0.0 | 7.4 | 3.7 | 444.4 | 75.7 |
| Matt DiBenedetto | 8 | 12.1 | 5.8 | 5.9 | 492.9 | 66.3 |
| Chris Buescher | 8 | 0.0 | 4.9 | 2.5 | 394.4 | 60.2 |
| Ryan Newman | 8 | 1.4 | 3.4 | 2.1 | 498.3 | 79.9 |
| Daniel Suarez | 7 | 0.7 | 6.6 | 3.5 | 499.4 | 75.4 |
| Martin Truex Jr | 8 | 21.0 | 31.6 | 21.1 | 485.1 | 89.3 |
Top-20 Drivers At Similar Races
(Bristol and Dover)
| | | Avg. | Run. | Avg. | Pos. | | Top | Top | Top |
| Driver | # | Start | Pos. | Finish | Diff. | W | 5 | 10 | 15 |
| Kevin Harvick | 16 | 12.8 | 9.1 | 8.6 | 4.2 | 3 | 7 | 12 | 14 |
| Kyle Busch | 16 | 10.9 | 10.3 | 12.2 | -1.3 | 4 | 7 | 10 | 11 |
| Jimmie Johnson | 16 | 15.5 | 11.6 | 9.0 | 6.5 | 2 | 6 | 12 | 14 |
| Denny Hamlin | 16 | 9.1 | 9.8 | 10.3 | -1.2 | 2 | 7 | 10 | 12 |
| Martin Truex Jr | 16 | 8.6 | 9.4 | 12.2 | -3.6 | 1 | 7 | 8 | 10 |
| Chase Elliott | 16 | 6.8 | 12.5 | 13.6 | -6.8 | 1 | 7 | 8 | 11 |
| Joey Logano | 16 | 11.1 | 11.3 | 12.0 | -0.9 | 0 | 4 | 9 | 12 |
| Clint Bowyer | 16 | 14.6 | 12.1 | 12.3 | 2.3 | 0 | 3 | 11 | 11 |
| Kurt Busch | 16 | 13 | 16.5 | 15.7 | -2.7 | 1 | 5 | 8 | 10 |
| Brad Keselowski | 16 | 9.4 | 12.1 | 16.6 | -7.2 | 1 | 2 | 6 | 9 |
| | | Avg. | Run. | Avg. | Pos. | | Top | Top | Top |
| Driver | # | Start | Pos. | Finish | Diff. | W | 5 | 10 | 15 |
| Erik Jones | 15 | 10.6 | 12.2 | 13.7 | -3.1 | 0 | 4 | 5 | 9 |
| Ryan Blaney | 16 | 9.4 | 12.5 | 20.3 | -10.9 | 0 | 1 | 5 | 9 |
| Alex Bowman | 11 | 12.8 | 15.5 | 15.5 | -2.7 | 0 | 4 | 5 | 6 |
| Daniel Suarez | 15 | 17.7 | 16.5 | 13.7 | 4.0 | 0 | 1 | 6 | 10 |
| Matt Kenseth | 9 | 14.4 | 15.2 | 15.9 | -1.5 | 0 | 2 | 2 | 5 |
| Austin Dillon | 16 | 18.6 | 17.5 | 16.3 | 2.3 | 0 | 1 | 4 | 10 |
| Ryan Newman | 16 | 16.6 | 17.3 | 15.9 | 0.7 | 0 | 1 | 4 | 9 |
| Ricky Stenhouse Jr | 16 | 15.4 | 20.3 | 20.7 | -5.3 | 0 | 2 | 5 | 7 |
| William Byron | 11 | 11.8 | 15.4 | 15.6 | -3.8 | 0 | 1 | 3 | 5 |
| Aric Almirola | 15 | 11.7 | 18.5 | 20.7 | -9.0 | 0 | 0 | 2 | 5 |
| | | Led | Fast Laps | Dominator | LC | Avg. |
| Driver | # | /Race | /Race | Pts. / Race | /Race | Rating |
| Kevin Harvick | 16 | 55.6 | 49.5 | 38.7 | 423.4 | 110.1 |
| Kyle Busch | 16 | 50.3 | 36.9 | 31.0 | 414.9 | 103.5 |
| Jimmie Johnson | 16 | 6.3 | 17.8 | 10.5 | 438.1 | 94.5 |
| Denny Hamlin | 16 | 36.4 | 18.3 | 18.3 | 437.6 | 99.1 |
| Martin Truex Jr | 16 | 34.8 | 35.2 | 26.3 | 432.1 | 104 |
| Chase Elliott | 16 | 38.0 | 21.8 | 20.4 | 394.2 | 93.1 |
| Joey Logano | 16 | 24.5 | 15.1 | 13.7 | 437.4 | 93.5 |
| Clint Bowyer | 16 | 11.6 | 12.8 | 9.3 | 435.6 | 90.7 |
| Kurt Busch | 16 | 2.3 | 8.3 | 4.7 | 391.9 | 79.5 |
| Brad Keselowski | 16 | 33.4 | 15.6 | 16.2 | 410.4 | 89.6 |
| | | Led | Fast Laps | Dominator | LC | Avg. |
| Driver | # | /Race | /Race | Pts. / Race | /Race | Rating |
| Erik Jones | 15 | 19.5 | 14.4 | 12.1 | 434.1 | 88.5 |
| Ryan Blaney | 16 | 29.8 | 12.4 | 13.7 | 380.9 | 89.9 |
| Alex Bowman | 11 | 3.8 | 14.7 | 8.3 | 403.2 | 83.3 |
| Daniel Suarez | 15 | 1.8 | 6.1 | 3.5 | 434.6 | 76.4 |
| Matt Kenseth | 9 | 1.3 | 9.8 | 5.2 | 411.2 | 81.9 |
| Austin Dillon | 16 | 3.1 | 4.6 | 3.1 | 414.8 | 72.8 |
| Ryan Newman | 16 | 0.8 | 3.1 | 1.8 | 436.3 | 73.6 |
| Ricky Stenhouse Jr | 16 | 2.2 | 10.4 | 5.8 | 380.2 | 69.6 |
| William Byron | 11 | 0.6 | 5.9 | 3.1 | 428.0 | 76.9 |
| Aric Almirola | 15 | 5.9 | 9.5 | 6.2 | 392.5 | 73.1 |
Momentum
This shows the last five races of the season and the driver’s stats so we can see who is coming in hot and who’s coming in cold.
Drivers
Tier 1
| | | Avg. | Run | Avg. | Pos. | | | | | LL | FL | Dominator | Avg. |
| Driver | # | Start | Pos. | Finish | Diff. | 1-5 | 6-10 | 11-15 | 16-20 | /Race | /Race | Pts./Race | Rating |
| Denny Hamlin | 5 | 8.2 | 8.4 | 9.6 | -1.4 | 3 | 0 | 2 | 0 | 37.6 | 25.6 | 22.2 | 105.8 |
| Kevin Harvick | 5 | 7.4 | 9.6 | 6.6 | 0.8 | 2 | 1 | 0 | 2 | 60.4 | 40 | 35.1 | 111.2 |
| Brad Keselowski | 5 | 7.4 | 10.7 | 7.8 | -0.4 | 1 | 2 | 2 | 0 | 40.4 | 13.2 | 16.7 | 99.5 |
| Chase Elliott | 5 | 11.4 | 15.6 | 14.2 | -2.8 | 4 | 0 | 0 | 1 | 28.6 | 20.2 | 17.3 | 85.9 |
| Kyle Busch | 5 | 14.4 | 10.2 | 12 | 2.4 | 1 | 2 | 0 | 0 | 7.6 | 11.4 | 7.6 | 97.7 |
| Martin Truex Jr | 5 | 8.8 | 6.1 | 6.4 | 2.4 | 4 | 0 | 0 | 0 | 59.6 | 29.8 | 29.8 | 115.8 |
| Joey Logano | 5 | 7.2 | 6.5 | 9.4 | -2.2 | 2 | 2 | 0 | 0 | 19.2 | 11.8 | 10.7 | 107.1 |
Tier 2
| | | Avg. | Run | Avg. | Pos. | | | | | LL | FL | Dominator | Avg. |
| Driver | # | Start | Pos. | Finish | Diff. | 1-5 | 6-10 | 11-15 | 16-20 | /Race | /Race | Pts./Race | Rating |
| Erik Jones | 5 | 17.8 | 16.3 | 19 | -1.2 | 1 | 0 | 2 | 0 | 3 | 4 | 2.8 | 78.4 |
| Kurt Busch | 5 | 14.8 | 17.1 | 21.6 | -6.8 | 0 | 1 | 2 | 0 | 4.2 | 6.4 | 4.3 | 74.0 |
| Ryan Blaney | 5 | 11.6 | 14.6 | 15 | -3.4 | 0 | 1 | 1 | 1 | 7.6 | 5.6 | 4.7 | 81.8 |
| Jimmie Johnson | 5 | 13.4 | 14.1 | 15.2 | -1.8 | 1 | 1 | 0 | 2 | 0.6 | 12.6 | 6.5 | 85.7 |
| Clint Bowyer | 5 | 10.6 | 11.7 | 12.2 | -1.6 | 0 | 4 | 0 | 1 | 0 | 5.6 | 2.8 | 85.6 |
| Aric Almirola | 5 | 9.2 | 14.7 | 11.8 | -2.6 | 0 | 2 | 0 | 2 | 4.6 | 8 | 5.2 | 83.4 |
| Matt DiBenedetto | 5 | 11.4 | 16 | 17.4 | -6 | 0 | 0 | 2 | 2 | 5.6 | 2.8 | 2.8 | 74.2 |
| William Byron | 5 | 9 | 13.5 | 11.8 | -2.8 | 2 | 1 | 0 | 0 | 5 | 5.6 | 4.1 | 89.3 |
| Austin Dillon | 5 | 13 | 13.3 | 11 | 2 | 2 | 0 | 1 | 0 | 20.8 | 18.8 | 14.6 | 91.2 |
Tier 3
| | | Avg. | Run | Avg. | Pos. | | | | | LL | FL | Dominator | Avg. |
| Driver | # | Start | Pos. | Finish | Diff. | 1-5 | 6-10 | 11-15 | 16-20 | /Race | /Race | Pts./Race | Rating |
| Ricky Stenhouse Jr | 5 | 22.6 | 20.4 | 23.2 | -0.6 | 0 | 1 | 0 | 3 | 0.2 | 11.2 | 5.7 | 69.0 |
| Alex Bowman | 5 | 9.6 | 13 | 9.6 | 0 | 0 | 3 | 1 | 0 | 0.4 | 10 | 5.1 | 90.6 |
| Ryan Newman | 5 | 19.8 | 20.2 | 23.4 | -3.6 | 0 | 0 | 1 | 2 | 0 | 2.8 | 1.4 | 64.8 |
| Cole Custer | 5 | 14.8 | 14.5 | 15.4 | -0.6 | 0 | 0 | 3 | 0 | 0 | 2.6 | 1.3 | 80.3 |
| Bubba Wallace | 5 | 23.6 | 22.1 | 23.4 | 0.2 | 1 | 0 | 0 | 0 | 0 | 1.2 | 0.6 | 60.1 |
| Tyler Reddick | 5 | 17.6 | 16 | 18.8 | -1.2 | 0 | 0 | 2 | 1 | 0.2 | 4.6 | 2.4 | 74.9 |
| John H. Nemechek | 5 | 26.2 | 23.7 | 24.2 | 2 | 0 | 0 | 1 | 0 | 0 | 2.2 | 1.1 | 58.6 |
| Matt Kenseth | 5 | 22.4 | 17.5 | 19.2 | 3.2 | 0 | 0 | 1 | 1 | 0.2 | 3.4 | 1.8 | 70.7 |
| Ty Dillon | 5 | 21.8 | 23.7 | 24.8 | -3 | 0 | 0 | 0 | 2 | 0 | 2.6 | 1.3 | 53.5 |
| Chris Buescher | 5 | 15.8 | 19.3 | 17.8 | -2.0 | 1 | 1 | 0 | 1 | 0 | 3.4 | 1.7 | 67.6 |
| Ryan Preece | 5 | 28.6 | 23.5 | 25.0 | 3.6 | 0 | 0 | 0 | 2 | 0 | 1.2 | 0.6 | 57.9 |
| Daniel Suarez | 5 | 29 | 26.1 | 27.6 | 1.4 | 0 | 0 | 0 | 0 | 3.8 | 0.8 | 1.4 | 50.4 |
Tier 4
| | | Avg. | Run | Avg. | Pos. | | | | | LL | FL | Dominator | Avg. |
| Driver | # | Start | Pos. | Finish | Diff. | 1-5 | 6-10 | 11-15 | 16-20 | /Race | /Race | Pts./Race | Rating |
| Michael McDowell | 5 | 21 | 22.3 | 21.2 | -0.2 | 0 | 1 | 1 | 1 | 0.4 | 2.2 | 1.2 | 61.7 |
| Corey Lajoie | 5 | 29 | 26.7 | 27.4 | 1.6 | 0 | 0 | 0 | 0 | 0 | 1.6 | 0.8 | 46.9 |
| Garrett Smithley | 2 | 39 | 36.3 | 36 | 3 | 0 | 0 | 0 | 0 | 0 | 1 | 0.5 | 29.5 |
| Timmy Hill | 5 | 34.8 | 35.9 | 33.4 | 1.4 | 0 | 0 | 0 | 0 | 0 | 1.8 | 0.9 | 30.7 |
| Gray Gaulding | | | | | | | | | | | | 0.0 | |
| Reed Sorenson | 3 | 36 | 35.2 | 36.0 | 0.0 | 0 | 0 | 0 | 0 | 0 | 0.7 | 0.4 | 32.3 |
| Joey Gase | 5 | 37.6 | 37.5 | 34.8 | 2.8 | 0 | 0 | 0 | 0 | 0 | 0 | 0.0 | 27.0 |
| Josh Bilicki | 4 | 36.8 | 35 | 33.5 | 3.3 | 0 | 0 | 0 | 0 | 0 | 1.5 | 0.8 | 33.2 |
| James Davison | 3 | 37.3 | 36.1 | 38.3 | -1 | 0 | 0 | 0 | 0 | 0 | 0 | 0.0 | 28.2 |
| Brennan Poole | 5 | 29.6 | 30 | 28.4 | 1.2 | 0 | 0 | 1 | 0 | 0.2 | 1.4 | 0.8 | 42.7 |
Team
| | | Avg. | Run | Avg. | Pos. | | | | | Laps | Fast |
| Team | # | Start | Pos. | Finish | Diff. | 1-5 | 6-10 | 11-15 | 16-20 | Led | Laps |
| Chip Ganassi Racing | 10 | 18.6 | 17.3 | 20.4 | -1.8 | 0 | 1 | 3 | 1 | 44 | 98 |
| Front Row Motorsports | 10 | 23.6 | 23.0 | 22.7 | 0.9 | 0 | 1 | 2 | 1 | 4 | 44 |
| Hendrick Motorsports | 20 | 10.9 | 14.1 | 12.7 | -1.9 | 7 | 5 | 1 | 3 | 692 | 968 |
| Joe Gibbs Racing | 20 | 12.3 | 10.3 | 11.8 | 0.6 | 9 | 2 | 4 | 0 | 2156 | 1416 |
| JTG Daugherty Racing | 10 | 25.6 | 22.0 | 24.1 | 1.5 | 0 | 1 | 0 | 5 | 2 | 124 |
| Richard Childress Racing | 10 | 15.3 | 14.7 | 14.9 | 0.4 | 2 | 0 | 3 | 1 | 210 | 234 |
| Roush Fenway Racing | 10 | 17.8 | 19.8 | 20.6 | -2.8 | 1 | 1 | 1 | 3 | 0 | 62 |
| Stewart-Haas Racing | 20 | 10.5 | 12.6 | 11.5 | -1.0 | 2 | 7 | 3 | 5 | 1300 | 1124 |
| Team Penske | 15 | 8.7 | 10.6 | 10.7 | -2.0 | 3 | 5 | 3 | 1 | 1008 | 459 |
Price Changes
These tables show the difference in pricing for each driver from the first race here in May to the race this weekend. A positive in the difference column means they are more expensive this time while a negative shows they are cheaper.
| DraftKings Price Changes | | FanDuel Price Changes |
| | Sept. | May | | | | Sept. | May | |
| Drivers | $ | $ | Difference | | Drivers | $ | $ | Difference |
| Brad Keselowski | $11,200 | $9,100 | $2,100 | | Brad Keselowski | $13,200 | $12,300 | $900 |
| Joey Logano | $9,700 | $10,700 | -$1,000 | | Joey Logano | $12,500 | $11,700 | $800 |
| Martin Truex Jr | $10,000 | $9,400 | $600 | | Martin Truex Jr | $11,600 | $12,500 | -$900 |
| Kevin Harvick | $11,600 | $12,200 | -$600 | | Kevin Harvick | $13,400 | $12,200 | $1,200 |
| Austin Dillon | $7,800 | $6,300 | $1,500 | | Austin Dillon | $10,000 | $7,000 | $3,000 |
| Chase Elliott | $10,700 | $11,300 | -$600 | | Chase Elliott | $13,000 | $13,000 | $0 |
| Denny Hamlin | $12,000 | $11,600 | $400 | | Denny Hamlin | $13,600 | $12,000 | $1,600 |
| Alex Bowman | $7,400 | $8,800 | -$1,400 | | Alex Bowman | $8,900 | $11,400 | -$2,500 |
| Kyle Busch | $10,400 | $12,500 | -$2,100 | | Kyle Busch | $12,000 | $14,000 | -$2,000 |
| Aric Almirola | $8,200 | $6,700 | $1,500 | | Aric Almirola | $9,000 | $8,000 | $1,000 |
| Clint Bowyer | $8,400 | $9,800 | -$1,400 | | Clint Bowyer | $10,700 | $9,000 | $1,700 |
| Cole Custer | $6,900 | $5,600 | $1,300 | | Cole Custer | $8,200 | $6,600 | $1,600 |
| | Sept. | May | | | | Sept. | May | |
| Drivers | $ | $ | Difference | | Drivers | $ | $ | Difference |
| Kurt Busch | $9,100 | $8,300 | $800 | | Kurt Busch | $11,000 | $10,600 | $400 |
| Ryan Blaney | $8,800 | $8,600 | $200 | | Ryan Blaney | $11,300 | $10,300 | $1,000 |
| William Byron | $7,900 | $7,700 | $200 | | William Byron | $8,800 | $9,300 | -$500 |
| Matt DiBenedetto | $8,100 | $7,100 | $1,000 | | Matt DiBenedetto | $9,700 | $8,300 | $1,400 |
| Tyler Reddick | $6,600 | $7,900 | -$1,300 | | Tyler Reddick | $7,500 | $7,300 | $200 |
| Christopher Bell | $7,100 | $7,300 | -$200 | | Christopher Bell | $8,600 | $6,000 | $2,600 |
| Matt Kenseth | $6,300 | $8,100 | -$1,800 | | Matt Kenseth | $7,000 | $8,000 | -$1,000 |
| Erik Jones | $9,400 | $7,000 | $2,400 | | Erik Jones | $9,200 | $9,600 | -$400 |
| Ricky Stenhouse Jr | $7,600 | $7,400 | $200 | | Ricky Stenhouse Jr | $7,200 | $6,200 | $1,000 |
| Ryan Preece | $5,700 | $6,000 | -$300 | | Ryan Preece | $5,000 | $5,000 | $0 |
| Chris Buescher | $6,000 | $5,800 | $200 | | Chris Buescher | $6,000 | $6,800 | -$800 |
| Jimmie Johnson | $8,600 | $10,200 | -$1,600 | | Jimmie Johnson | $9,400 | $10,000 | -$600 |
| | Sept. | May | | | | Sept. | May | |
| Drivers | $ | $ | Difference | | Drivers | $ | $ | Difference |
| Ryan Newman | $7,300 | $6,800 | $500 | | Ryan Newman | $8,000 | $7,700 | $300 |
| Michael McDowell | $5,900 | $4,900 | $1,000 | | Michael McDowell | $5,000 | $4,500 | $500 |
| Bubba Wallace | $6,800 | $7,500 | -$700 | | Bubba Wallace | $6,600 | $5,000 | $1,600 |
| Ty Dillon | $6,100 | $6,100 | $0 | | Ty Dillon | $4,500 | $5,500 | -$1,000 |
| Daniel Suarez | $5,400 | $6,500 | -$1,100 | | Daniel Suarez | $5,000 | $4,000 | $1,000 |
| Corey Lajoie | $5,500 | $5,700 | -$200 | | Corey Lajoie | $3,500 | $3,000 | $500 |
| John H. Nemechek | $6,400 | $5,500 | $900 | | John H. Nemechek | $5,500 | $6,400 | -$900 |
| Brennan Poole | $4,600 | $5,400 | -$800 | | Brennan Poole | $3,500 | $2,500 | $1,000 |
| Quin Houff | $4,500 | $4,700 | -$200 | | Quin Houff | $3,000 | $2,500 | $500 |
| Reed Sorenson | $5,000 | | | | Reed Sorenson | $3,000 | | |
| James Davison | $4,700 | | | | James Davison | $3,000 | | |
| Joey Gase | $4,900 | $4,600 | $300 | | Joey Gase | $3,000 | $2,000 | $1,000 |
| Gray Gaulding | $5,100 | $5,000 | $100 | | Gray Gaulding | $3,000 | $2,000 | $1,000 |
| Timmy Hill | $5,200 | $5,100 | $100 | | Timmy Hill | $3,000 | $2,000 | $1,000 |
| Josh Bilicki | $4,800 | | | | Josh Bilicki | $3,000 | |
Finish Ranges By Starting Spot Ranges
| Start | Finish Ranges |
| Range | 1-5 | 6-10 | 11-15 | 16-20 | 20+ |
| 1-5 | 6 | 2 | 2 | 3 | 7 |
| 6-10 | 5 | 5 | 3 | 1 | 6 |
| 11-15 | 3 | 5 | 3 | 5 | 4 |
| 16-20 | 2 | 5 | 4 | 1 | 8 |
| 21-25 | 2 | 1 | 6 | 4 | 7 |
| 26-30 | 1 | 0 | 1 | 4 | 14 |
| 31-35 | 1 | 1 | 1 | 0 | 16 |
| 36-40 | 0 | 1 | 0 | 2 | 13 |
| Total | 20 | 20 | 20 | 20 | 75 |
Weekly Rankings
Race Hist, Track Hist, Type Hist are all ranked on average finish position over the last four races at the track, five races this season, eight races at this track, and similar races respectively. The Avg. Rating and Top-15 % columns are ranked on those categories in the last four races at this track. The L8 PD column ranks the position differential over the last eight races from best (most positive) to worst (most negative).
Tier 1
| Driver | DK$ | FD $ | Race Hist | Recent Form | DK L2 | FD L2 | DK L5 | FD L5 | Track Hist | Type Hist |
| Denny Hamlin | $12,000 | $13,600 | 5 | 6 | 10 | 3 | 17 | 4 | 2 | 3 |
| Kevin Harvick | $11,600 | $13,400 | 19 | 2 | 31 | 7 | 20 | 7 | 6 | 1 |
| Brad Keselowski | $11,200 | $13,200 | 6 | 3 | 5 | 2 | 13 | 3 | 21 | 17 |
| Chase Elliott | $10,700 | $13,000 | 7 | 13 | 12 | 4 | 16 | 5 | 12 | 8 |
| Kyle Busch | $10,400 | $12,000 | 3 | 11 | 1 | 1 | 3 | 1 | 8 | 5 |
| Martin Truex Jr | $10,000 | $11,600 | 21 | 1 | 21 | 5 | 27 | 6 | 23 | 5 |
| Joey Logano | $9,700 | $12,500 | 9 | 5 | 27 | 6 | 9 | 2 | 4 | 4 |
Tier 2
| Driver | DK$ | FD $ | Race Hist | Recent Form | DK L2 | FD L2 | DK L5 | FD L5 | Track Hist | Type Hist |
| Erik Jones | $9,400 | $9,200 | 13 | 20 | 17 | 4 | 25 | 4 | 13 | 9 |
| Kurt Busch | $9,100 | $11,000 | 1 | 23 | 20 | 5 | 12 | 5 | 10 | 13 |
| Ryan Blaney | $8,800 | $11,300 | 14 | 14 | 28 | 9 | 11 | 8 | 24 | 21 |
| Jimmie Johnson | $8,600 | $9,400 | 7 | 15 | 11 | 1 | 8 | 1 | 1 | 2 |
| Clint Bowyer | $8,400 | $10,700 | 2 | 12 | 6 | 2 | 4 | 2 | 5 | 7 |
| Aric Almirola | $8,200 | $9,000 | 33 | 9 | 35 | 8 | 36 | 9 | 28 | 23 |
| Matt DiBenedetto | $8,100 | $9,700 | 16 | 17 | 13 | 6 | 19 | 6 | 19 | 22 |
| William Byron | $7,900 | $8,800 | 18 | 9 | 15 | 3 | 28 | 3 | 15 | 12 |
| Austin Dillon | $7,800 | $10,000 | 16 | 8 | 24 | 7 | 22 | 7 | 16 | 16 |
Tier 3
| Driver | DK$ | FD $ | Race Hist | Recent Form | DK L2 | FD L2 | DK L5 | FD L5 | Track Hist | Type Hist |
| Ricky Stenhouse Jr | $7,600 | $7,200 | 31 | 26 | 37 | 9 | 32 | 9 | 20 | 23 |
| Alex Bowman | $7,400 | $8,900 | 24 | 6 | 34 | 8 | 26 | 8 | 17 | 11 |
| Ryan Newman | $7,300 | $8,000 | 10 | 27 | 18 | 7 | 10 | 5 | 8 | 14 |
| Cole Custer | $6,900 | $8,200 | 35 | 16 | 36 | 10 | 37 | 10 | 37 | 18 |
| Bubba Wallace | $6,800 | $6,600 | 23 | 27 | 8 | 3 | 15 | 7 | 21 | 25 |
| Tyler Reddick | $6,600 | $7,500 | 39 | 19 | 38 | 11 | 38 | 11 | 39 | 27 |
| John H. Nemechek | $6,400 | $5,500 | 11 | 29 | 40 | | 40 | | 7 | 19 |
| Matt Kenseth | $6,300 | $7,000 | 15 | 21 | 14 | 5 | 14 | 4 | 14 | 14 |
| Ty Dillon | $6,100 | $4,500 | 25 | 30 | 29 | 6 | 23 | 3 | 27 | 29 |
| Chris Buescher | $6,000 | $6,000 | 22 | 18 | 16 | 4 | 24 | 6 | 25 | 28 |
| Ryan Preece | $5,700 | $5,000 | 19 | 31 | 7 | 2 | 7 | 2 | 18 | 25 |
| Daniel Suarez | $5,400 | $5,000 | 11 | 33 | 2 | 1 | 2 | 1 | 11 | 9 |
Tier 4
| Driver | DK$ | FD $ | Race Hist | Recent Form | DK L2 | FD L2 | DK L5 | FD L5 | Track Hist | Type Hist |
| Michael McDowell | $5,900 | $5,000 | 29 | 22 | 23 | 7 | 35 | 9 | 30 | 30 |
| Corey Lajoie | $5,500 | $3,500 | 31 | 32 | 25 | 5 | 29 | 5 | 31 | 31 |
| Garrett Smithley | $5,300 | $3,000 | 27 | 41 | 19 | 2 | 18 | 2 | 29 | 35 |
| Timmy Hill | $5,200 | $3,000 | 28 | 36 | 4 | 1 | 5 | 1 | 33 | 36 |
| Gray Gaulding | $5,100 | $3,000 | 37 | | 26 | 4 | 33 | 8 | 35 | 33 |
| Reed Sorenson | $5,000 | $3,000 | 38 | 41 | 33 | 9 | 30 | 6 | 34 | 38 |
| Joey Gase | $4,900 | $3,000 | 34 | 40 | 32 | 8 | 34 | 7 | 36 | 39 |
| Josh Bilicki | $4,800 | $3,000 | 35 | 37 | 30 | 6 | 31 | 4 | 37 | 37 |
| James Davison | $4,700 | $3,000 | 40 | 43 | 40 | | 40 | | 40 | 40 |
| Brennan Poole | $4,600 | $3,500 | 26 | 34 | 9 | 3 | 6 | 3 | 26 | 32 |
DFS Value Averages
This replaces the DFS Scoring Averages table that had been here. Instead, we have the DFS Value figures instead. We have taken their points scored over the last two and five races on each site and averaged those out and then divided that average by their salary divided by 1,000.
Tier 1
| | DK | DK | DK | Seas. | FD | FD | FD | Seas. |
| Driver | Salary | L2 | L5 | Avg | Salary | L2 | L5 | Avg |
| Denny Hamlin | $12,000 | 6.31 | 4.44 | 4.30 | $13,600 | 6.78 | 6.29 | 4.48 |
| Kevin Harvick | $11,600 | 1.68 | 4.23 | 5.33 | $13,400 | 3.44 | 5.22 | 4.86 |
| Brad Keselowski | $11,200 | 8.28 | 5.15 | 4.25 | $13,200 | 7.83 | 6.32 | 4.47 |
| Chase Elliott | $10,700 | 5.15 | 4.57 | 4.16 | $13,000 | 6.14 | 6.00 | 4.16 |
| Kyle Busch | $10,400 | 8.94 | 8.09 | 3.12 | $12,000 | 8.42 | 7.95 | 4.09 |
| Martin Truex Jr | $10,000 | 4.15 | 2.97 | 4.63 | $11,600 | 6.10 | 5.53 | 4.80 |
| Joey Logano | $9,700 | 2.29 | 5.94 | 3.92 | $12,500 | 5.34 | 6.79 | 4.29 |
Tier 2
| | DK | DK | DK | Seas. | FD | FD | FD | Seas. |
| Driver | Salary | L2 | L5 | Avg | Salary | L2 | L5 | Avg |
| Erik Jones | $9,400 | 4.64 | 3.56 | 3.42 | $9,200 | 8.44 | 7.86 | 5.43 |
| Kurt Busch | $9,100 | 4.38 | 5.17 | 3.47 | $11,000 | 7.58 | 7.77 | 4.59 |
| Ryan Blaney | $8,800 | 2.19 | 5.35 | 4.31 | $11,300 | 4.02 | 5.37 | 4.36 |
| Jimmie Johnson | $8,600 | 6.25 | 5.94 | 4.08 | $9,400 | 9.34 | 9.27 | 5.31 |
| Clint Bowyer | $8,400 | 7.62 | 7.83 | 4.02 | $10,700 | 8.93 | 8.71 | 4.77 |
| Aric Almirola | $8,200 | -0.52 | 0.56 | 4.19 | $9,000 | 5.21 | 4.79 | 5.75 |
| Matt DiBenedetto | $8,100 | 5.02 | 4.38 | 3.74 | $9,700 | 7.57 | 7.70 | 5.23 |
| William Byron | $7,900 | 4.78 | 2.89 | 3.91 | $8,800 | 8.81 | 7.98 | 5.55 |
| Austin Dillon | $7,800 | 3.14 | 3.95 | 4.50 | $10,000 | 6.51 | 7.34 | 5.19 |
Tier 3
| | DK | DK | DK | Seas. | FD | FD | FD | Seas. |
| Driver | Salary | L2 | L5 | Avg | Salary | L2 | L5 | Avg |
| Ricky Stenhouse Jr | $7,600 | -0.69 | 1.78 | 3.11 | $7,200 | 4.09 | 6.86 | 5.67 |
| Alex Bowman | $7,400 | 0.57 | 3.45 | 4.05 | $8,900 | 4.89 | 7.36 | 5.27 |
| Ryan Newman | $7,300 | 4.62 | 5.69 | 3.23 | $8,000 | 9.90 | 10.44 | 5.63 |
| Cole Custer | $6,900 | -0.58 | -0.58 | 3.91 | $8,200 | 2.72 | 2.72 | 5.68 |
| Bubba Wallace | $6,800 | 7.21 | 4.69 | 3.78 | $6,600 | 13.24 | 9.85 | 6.77 |
| Tyler Reddick | $6,600 | -1.06 | -1.06 | 4.68 | $7,500 | 2.71 | 2.71 | 6.50 |
| John H. Nemechek | $6,400 | | | 3.93 | $5,500 | | | 8.08 |
| Matt Kenseth | $6,300 | 4.92 | 4.92 | 3.53 | $7,000 | 10.57 | 10.57 | 6.43 |
| Ty Dillon | $6,100 | 1.89 | 3.85 | 4.35 | $4,500 | 9.97 | 13.71 | 9.99 |
| Chris Buescher | $6,000 | 4.71 | 3.77 | 4.33 | $6,000 | 12.11 | 10.05 | 7.83 |
| Ryan Preece | $5,700 | 7.41 | 6.37 | 3.42 | $5,000 | 16.47 | 15.52 | 7.79 |
| Daniel Suarez | $5,400 | 8.70 | 8.10 | 4.75 | $5,000 | 17.04 | 16.59 | 8.81 |
Tier 4
| | DK | DK | DK | Seas. | FD | FD | FD | Seas. |
| Driver | Salary | L2 | L5 | Avg | Salary | L2 | L5 | Avg |
| Michael McDowell | $5,900 | 3.35 | 0.80 | 4.99 | $5,000 | 11.88 | 6.70 | 9.67 |
| Corey Lajoie | $5,500 | 3.09 | 2.78 | 4.35 | $3,500 | 16.27 | 14.23 | 12.10 |
| Garrett Smithley | $5,300 | 4.43 | 4.43 | 2.14 | $3,000 | 22.13 | 22.13 | 9.97 |
| Timmy Hill | $5,200 | 8.46 | 6.63 | 2.80 | $3,000 | 27.17 | 24.52 | 9.82 |
| Gray Gaulding | $5,100 | 2.75 | 1.52 | 2.81 | $3,000 | 18.87 | 10.64 | 13.66 |
| Reed Sorenson | $5,000 | 1.00 | 2.33 | 3.04 | $3,000 | 9.80 | 13.10 | 11.29 |
| Joey Gase | $4,900 | 1.12 | 1.12 | 2.47 | $3,000 | 11.73 | 11.73 | 10.36 |
| Josh Bilicki | $4,800 | 1.88 | 1.88 | 2.94 | $3,000 | 14.43 | 14.43 | 11.11 |
| James Davison | $4,700 | | | 1.93 | $3,000 | | | 7.76 |
| Brennan Poole | $4,600 | 6.63 | 6.63 | 3.62 | $3,500 | 20.40 | 20.40 | 10.34 |

