The final weekend of the NASCAR Goes West portion of the schedule is upon us this weekend with the only stop at Auto Club Speedway, also referred to as Fontana, on the schedule. The speedway is located just east of Los Angeles giving us perhaps the most star-studded race weekend of the schedule aside from Daytona as a lot of movie stars come out to see the high-speeds and thrills of racing on the two-mile track.
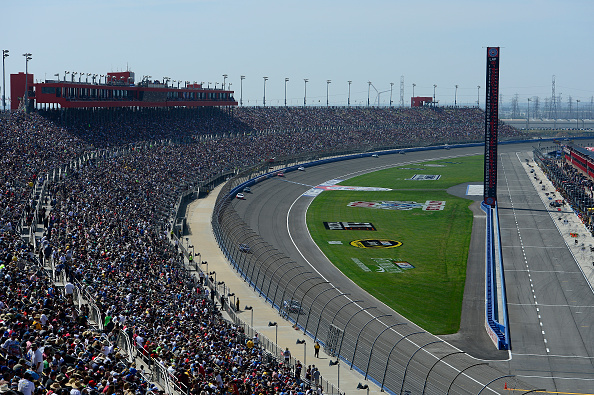
Auto Club Speedway is one of only two two-mile tracks on the schedule, the other being Michigan International Speedway, and it is also a D-shaped track, much like Michigan is. The aerial views of the track elaborate as to why it’s known as a D-shaped circuit but suffice to say it’s because the entire front-stretch is curved, and banked, in order to give the spectators all a great view of the race. The track opened in 1997 and has hosted a race ever since though most have been 500-milers until the last time there was a second race a year at the track in 2010. From 1997 through 2003 there was just one race a year here and then from 2004 to 2010, there were two a year before returning to one trip a season from 2011 through the present.
Overall the track is a wide two-miler and a shallow one at that with just 14 degrees of bank in the turns. There are multiple grooves in the track, and you will see 4-5 wide at points and certainly a lot of three-wide action on this older surface. Speaking of the surface, it’s old. Like really old. We’re talking Atlanta and Chicagoland levels of old and worn. Tire wear will be an issue on Sunday and drivers will be wanting as many sets of four tires as they can get on their cars. The tires combined with the aero package should make it a wide-open race on Sunday in terms of cars going all over the track. That being said, there have been two drivers to lead a combined 160-plus laps in four of the last six races so laps led dominators will be a thing to focus on for Sunday.
In terms of position movement, there has been the same number of drivers moving up by double-digits as there have been moving backward by double-digits in the last four races here. With as much passing as we’ve seen in the previous three races this season with this aero package and this being the widest track they’ve raced on since Daytona, it should be a pass fest on Sunday.
Track Data
Drivers To Watch This Week
Last Five Auto Club 400s
Avg.
Run
Avg.
Pos.
Top
Top
Top
Top
Driver
#
Start
Pos
Finish
Diff.
W
5
10
15
20
Brad Keselowski
5
8
10.2
8.4
-1
1
3
4
4
4
Kyle Larson
5
10
14
14
-4
1
3
3
3
3
Kyle Busch
4
7.8
5.8
9.3
-1.5
1
2
3
3
3
Martin Truex Jr
5
9
10.6
13.6
-4
1
2
3
3
3
Jimmie Johnson
5
21
10
12.8
8
1
1
3
3
3
Joey Logano
5
14
10.4
12
2
0
3
4
4
4
Kurt Busch
5
13
16.2
14.8
-2
0
2
2
3
3
Kevin Harvick
5
5
16.4
17.6
-12.6
0
2
2
3
3
Paul Menard
5
18
17.4
15
3
0
1
2
3
4
Denny Hamlin
4
9
9.5
12.8
-4
0
1
2
3
3
Ryan Newman
5
9
15.2
15
-6
0
1
1
3
4
Clint Bowyer
5
17
13.6
15.6
2
0
1
1
2
4
Ricky Stenhouse Jr
5
20
19.2
18.8
1
0
1
1
2
3
Chase Elliott
3
17
9.7
10.7
7
0
0
2
2
3
Ryan Blaney
3
14
14.7
17.3
-4
0
0
2
2
2
Avg.
Run
Avg.
Pos.
Top
Top
Top
Top
Driver
#
Start
Pos
Finish
Diff.
W
5
10
15
20
Austin Dillon
5
12
16
14.4
-3
0
0
1
3
4
Erik Jones
2
9
7
9.5
-1
0
0
1
2
2
Daniel Suarez
2
20
18.5
15
5
0
0
1
1
1
Aric Almirola
5
25
20.8
21.2
4
0
0
0
2
3
William Byron
1
29
16
15
14
0
0
0
1
1
Bubba Wallace
1
19
24
20
-1
0
0
0
0
1
Ty Dillon
2
19
22.5
22.5
-4
0
0
0
0
1
Alex Bowman
3
32
26.3
22.7
9
0
0
0
1
1
Landon Cassill
4
36
28.8
23.3
13
0
0
0
0
1
David Ragan
5
26
28.8
24.6
1
0
0
0
0
1
Chris Buescher
4
20
26.8
27
-7
0
0
0
0
1
Avg.
Run
Avg.
Pos.
Top
Top
Top
Top
Driver
#
Start
Pos
Finish
Diff.
W
5
10
15
20
Ross Chastain
1
36
29
29
7
0
0
0
0
0
Reed Sorenson
3
30
34
29.7
0
0
0
0
0
0
Michael McDowell
3
25.7
27.7
30
-4.3
0
0
0
0
0
Corey LaJoie
1
30
31
30
0
0
0
0
0
Matt DiBenedetto
4
33
32.8
32.3
1
0
0
0
0
0
Daniel Hemric
0
0
0
0
0
0
0
0
0
0
Matt Tifft
0
0
0
0
0
0
0
0
0
0
Ryan Preece
0
0
0
0
0
0
0
0
0
0
Cody Ware
0
0
0
0
0
0
0
0
0
0
BJ McLeod
0
0
0
0
0
0
0
0
0
0
Joey Gase
0
0
0
0
0
0
0
0
0
0
Laps
Laps Led
Fastest
Fast Laps
Top-15
Avg. Driver
Laps
Driver
#
Led
/ Race
Laps
/ Race
Rate
Rating
Comp.
Brad Keselowski
5
39
7.8
32
6.4
82%
99.2
1021
Kyle Larson
5
110
22
51
10.2
71%
91.9
863
Kyle Busch
4
74
18.5
55
13.8
96%
111.1
813
Martin Truex Jr
5
224
44.8
115
23
74%
106.3
1021
Jimmie Johnson
5
129
25.8
77
15.4
72%
103.7
1022
Joey Logano
5
13
2.6
28
5.6
84%
100.3
1011
Kurt Busch
5
67
13.4
55
11
58%
83.7
1020
Kevin Harvick
5
176
35.2
119
23.8
53%
95.4
1011
Paul Menard
5
2
0.4
11
2.2
52%
76.8
1019
Denny Hamlin
4
63
15.8
28
7
84%
99.3
816
Ryan Newman
5
3
0.6
1
0.2
56%
77.5
1021
Clint Bowyer
5
2
0.4
12
2.4
54%
84.6
1021
Ricky Stenhouse Jr
5
0
0
9
1.8
37%
69.7
1019
Chase Elliott
3
5
1.7
26
8.7
79%
95.2
606
Laps
Laps Led
Fastest
Fast Laps
Top-15
Avg. Driver
Laps
Driver
#
Led
/ Race
Laps
/ Race
Rate
Rating
Comp.
Ryan Blaney
3
0
0
13
4.3
64%
84.1
597
Austin Dillon
5
0
0
1
0.2
46%
79.8
1022
Erik Jones
2
0
0
4
2
98%
101
402
Daniel Suarez
2
0
0
0
0
24%
68.8
401
Aric Almirola
5
0
0
0
0
29%
69.1
883
William Byron
1
1
1
0
0
61%
71
199
Bubba Wallace
1
0
0
0
0
2%
53
199
Ty Dillon
2
1
0.5
4
2
22%
55.5
400
Alex Bowman
3
1
0.3
0
0
16%
53.1
613
Landon Cassill
4
0
0
3
0.8
2%
46.7
819
David Ragan
5
1
0.2
2
0.4
4%
49.6
1017
Chris Buescher
4
0
0
29
7.3
3%
53.8
811
Laps
Laps Led
Fastest
Fast Laps
Top-15
Avg. Driver
Laps
Driver
#
Led
/ Race
Laps
/ Race
Rate
Rating
Comp.
Ross Chastain
1
0
0
0
0
5%
36.7
198
Reed Sorenson
3
1
0.3
0
0
1%
33.8
596
Michael McDowell
3
0
0
0
0
2%
42.8
602
Corey LaJoie
1
0
0
0
0
0%
38.8
200
Matt DiBenedetto
4
0
0
9
2.3
0%
37.1
804
Daniel Hemric
0
0
0
0
0
0%
0
0
Matt Tifft
0
0
0
0
0
0%
0
0
Ryan Preece
0
0
0
0
0
0%
0
0
Cody Ware
0
0
0
0
0
0%
0
0
BJ McLeod
0
0
0
0
0
0%
0
0
Joey Gase
0
0
0
0
0
0%
0
0
Top-15 Drivers Over Last 10 Races At Auto Club Speedway
Avg.
Run
Avg.
Pos.
Top
Top
Top
Top
Driver
#
Start
Pos.
Finish
Diff.
W
5
10
15
20
Kyle Busch
9
7.8
6
10.2
-2.4
2
5
6
7
7
Jimmie Johnson
10
16.5
8.5
9.2
7.3
2
4
7
8
8
Kevin Harvick
10
9.7
12.7
11.5
-1.8
1
5
6
8
8
Brad Keselowski
10
12.6
15
15.6
-3
1
3
4
4
5
Kyle Larson
5
10.4
14
14
-3.6
1
3
3
3
3
Martin Truex Jr
10
13.2
14.3
17.2
-4
1
2
4
4
6
Joey Logano
10
11.6
12.8
12.8
-1.2
0
5
6
7
7
Ryan Newman
10
11
13.9
13.8
-2.8
0
3
5
7
8
Kurt Busch
10
17.2
17.2
13.2
4
0
3
5
6
7
Clint Bowyer
10
14.4
11.4
14.3
0.1
0
2
4
6
8
Paul Menard
10
22
18.5
15.8
6.2
0
1
3
4
8
Denny Hamlin
9
11
11.4
18.1
-7.1
0
1
3
5
5
Ricky Stenhouse Jr
6
21.7
19.2
19
2.7
0
1
1
2
4
Chase Elliott
3
17.3
9.7
10.7
6.6
0
0
2
2
3
Ryan Blaney
3
13.7
14.7
17.3
-3.6
0
0
2
2
2
Laps
Laps Led
Fastest
Fast Laps
Top-15
Avg. Driver
Driver
#
Led
/ Race
Laps
/ Race
Rate
Rating
Kyle Busch
9
445
49.44
174
19.33
94%
117
Jimmie Johnson
10
257
25.7
151
15.1
81%
109
Kevin Harvick
10
205
20.5
198
19.8
68%
102
Brad Keselowski
10
39
3.9
36
3.6
56%
83.2
Kyle Larson
5
110
22
51
10.2
71%
91.9
Martin Truex Jr
10
225
22.5
150
15
62%
93
Joey Logano
10
54
5.4
60
6
64%
93.3
Ryan Newman
10
11
1.1
16
1.6
66%
85.4
Kurt Busch
10
68
6.8
63
6.3
47%
82.3
Clint Bowyer
10
45
4.5
71
7.1
70%
94.5
Paul Menard
10
5
0.5
16
1.6
40%
74.3
Denny Hamlin
9
89
9.89
48
5.33
74%
94.5
Ricky Stenhouse Jr
6
0
0
9
1.5
34%
69.1
Chase Elliott
3
5
1.67
26
8.67
79%
95.2
Ryan Blaney
3
0
0
13
4.33
64%
84.1
Top-15 Drivers at Similar Tracks (Auto Club, Chicagoland, Michigan)
Avg.
Run
Avg.
Pos.
Top
Top
Top
Top
Driver
#
Start
Pos.
Finish
Diff.
W
5
10
15
20
Kyle Larson
17
12.9
11.1
9.9
3.0
4
10
11
12
14
Brad Keselowski
21
9.3
8.5
8.4
0.9
3
9
16
16
19
Kyle Busch
20
7.1
8.6
9
-1.9
3
9
15
17
18
Martin Truex Jr
21
12
10.7
10.9
1.1
3
7
11
15
19
Kevin Harvick
21
9.1
10.7
11.2
-2.1
1
12
12
17
18
Joey Logano
21
9
9.5
10.7
-1.7
1
8
17
17
17
Denny Hamlin
20
9.9
9.4
12.4
-2.5
1
5
11
14
16
Jimmie Johnson
21
15.3
11.4
13.7
1.6
1
3
9
14
17
Clint Bowyer
21
16
15.1
19.5
-3.5
1
3
5
9
12
Kurt Busch
21
14.1
14.2
12.3
1.8
0
6
10
15
18
Chase Elliott
12
11.8
8.4
7.3
4.5
0
5
10
10
12
Ryan Newman
21
12.5
14.8
13.1
-0.6
0
4
8
15
18
Ryan Blaney
13
11
12.2
14.1
-3.1
0
3
6
8
10
Austin Dillon
17
11.8
16
16.4
-4.6
0
2
5
9
13
Paul Menard
21
19.6
18.2
16.7
2.9
0
2
4
9
15
Laps
Laps Led
Fastest
Fast Laps
Top-15
Avg. Driver
Driver
#
Led
/ Race
Laps
/ Race
Rate
Rating
Kyle Larson
17
280
16.5
239
14.1
79%
100.4
Brad Keselowski
21
334
15.9
252
12
88%
103.7
Kyle Busch
20
764
38.2
391
19.6
84%
110.8
Martin Truex Jr
21
533
25.4
462
22
74%
102.3
Kevin Harvick
21
571
27.2
432
20.6
73%
106.7
Joey Logano
21
251
12
167
8
84%
101.8
Denny Hamlin
20
110
5.5
112
5.6
87%
98.3
Jimmie Johnson
21
515
24.5
305
14.5
68%
96
Clint Bowyer
21
38
1.8
69
3.3
58%
82.5
Kurt Busch
21
170
8.1
143
6.8
62%
88.8
Chase Elliott
12
188
15.7
157
13.1
86%
103.9
Ryan Newman
21
21
1
31
1.5
54%
81.5
Ryan Blaney
13
42
3.2
77
5.9
71%
90.4
Austin Dillon
17
38
2.2
43
2.5
51%
80.2
Paul Menard
21
6
0.3
29
1.4
38%
72.7
DraftKings Scoring Averages Over Last Five Auto Club 400s
Driver
2018
2017
2016
2015
2014
Last 2 Avg
Last 5 Avg
DK Seas. Avg.
Kyle Busch
68.5
47.25
2.5
63.75
57.88
45.50
62.33
Joey Logano
46.75
74.75
47.75
44.5
-26.5
60.75
37.45
52
Kyle Larson
48.5
92.5
-2
-2.5
51.5
70.50
37.60
49.92
Kevin Harvick
-10.5
28
102.5
73
-20.5
8.75
34.50
49.71
Kurt Busch
23
11.5
12
80.25
55.5
17.25
36.45
47
Brad Keselowski
50.5
44
41.5
60.25
7.5
47.25
40.75
42.25
Martin Truex Jr
111.75
75.75
7.75
41.25
10
93.75
49.30
41.50
Aric Almirola
47
37
27
45
-21
42.00
27.00
41.25
Denny Hamlin
59.75
20.5
43.5
16
40.13
34.94
39.38
Clint Bowyer
48
58
37.5
-6
20
53.00
31.50
37.38
Ryan Blaney
42.5
45
-12
43.75
25.17
37.33
Ricky Stenhouse Jr
25.5
16
52
42
0
20.75
27.10
35.1
Chase Elliott
43
48.5
42.75
45.75
44.75
35
Jimmie Johnson
59
41.5
79.25
43
49
50.25
54.35
34.67
Driver
2018
2017
2016
2015
2014
Last 2 Avg
Last 5 Avg
DK Seas. Avg.
Ryan Newman
11
19
20
43
21.25
15.00
22.85
34.33
Erik Jones
34
36
35.00
35.00
33.58
Chris Buescher
-1
14
4.5
38
6.50
13.88
31.3
Ty Dillon
7
31.25
19.13
19.13
30.7
Ross Chastain
22
22.00
22.00
28.2
Daniel Suarez
28
40
34.00
34.00
28.08
Paul Menard
25
12
27
47
56
18.50
33.40
26.71
Austin Dillon
29
33.5
-3
33
42
31.25
26.90
25.88
Matt DiBenedetto
1
24
26.5
2
12.50
13.38
24.55
Corey LaJoie
14
14.00
14.00
24.5
Alex Bowman
46
6.25
40
46.00
30.75
23.04
BJ McLeod
22
Driver
2018
2017
2016
2015
2014
Last 2 Avg
Last 5 Avg
DK Seas. Avg.
William Byron
43.25
43.25
43.25
21.9
Ryan Preece
20.9
David Ragan
15
9
35
13
31.25
12.00
20.65
19.6
Matt Tifft
19.2
Landon Cassill
16.5
46
35
38
16.50
33.88
18.85
Bubba Wallace
23
23.00
23.00
17.7
Daniel Hemric
17.25
Michael McDowell
14
3
12
8.50
9.67
14.9
Joey Gase
14.5
Cody Ware
12.3
Reed Sorenson
0
5
38.25
2.50
14.42
9
FanDuel Scoring Averages Over Last Five Auto Club 400s
Driver
2018
2017
2016
2015
2014
Last 2 Avg
Last 5 Avg
FD Seas. Avg.
Kyle Busch
63.7
54.4
27
70.6
59.05
53.93
59.30
Joey Logano
57.4
71.3
60.3
57.9
5.5
64.35
50.48
59.23
Kyle Larson
60.5
74.2
3.1
25.4
65.1
67.35
45.66
55.22
Kevin Harvick
12.6
45.2
74.7
64.3
9.4
28.90
41.24
54.38
Kurt Busch
43.4
32.6
29.5
64.4
65.8
38.00
47.14
57.88
Brad Keselowski
60.5
60.7
55.5
67.5
27.3
60.60
54.30
52.05
Martin Truex Jr
75.5
64.5
24
56.4
33.1
70.00
50.70
50.47
Aric Almirola
56.4
48.2
42.5
56.9
-3.2
52.30
40.16
53.02
Denny Hamlin
64.6
41.6
58.7
28.5
53.10
48.35
54.05
Clint Bowyer
57.4
65.2
49
21.9
40.3
61.30
46.76
51.07
Ryan Blaney
53
57.2
15
55.10
41.73
47.50
Ricky Stenhouse Jr
41.9
36.2
63
52.9
21.4
39.05
43.08
53.84
Chase Elliott
52.4
53.1
56.6
52.75
54.03
48.87
Jimmie Johnson
64
48.2
75
55.4
37.5
56.10
56.02
50.43
Ryan Newman
33.9
41.2
42.5
58.9
39.9
37.55
43.28
49.22
Driver
2018
2017
2016
2015
2014
Last 2 Avg
Last 5 Avg
FD Seas. Avg.
Erik Jones
52.5
50.2
51.35
51.35
47.95
Chris Buescher
21.7
33.6
19.9
48.4
27.65
30.90
48.58
Ty Dillon
28.8
44.8
36.80
36.80
48.22
Ross Chastain
35.3
35.30
35.30
43.58
Daniel Suarez
41.4
55.7
48.55
48.55
43.63
Paul Menard
39.4
30.7
45.5
61.4
63.1
35.05
48.02
44.25
Austin Dillon
48.5
50.2
26
48.4
55.1
49.35
45.64
43.33
Matt DiBenedetto
23.1
36.5
37.5
21.3
29.80
29.60
42.40
Corey LaJoie
31
31.00
31.00
42.14
Alex Bowman
55.4
26.4
48.6
55.40
43.47
40.58
BJ McLeod
36.00
William Byron
53
53.00
53.00
42.24
Ryan Preece
38.64
Driver
2018
2017
2016
2015
2014
Last 2 Avg
Last 5 Avg
FD Seas. Avg.
David Ragan
33.9
27.9
46
36.9
41.6
30.90
37.26
40.28
Matt Tifft
37.36
Landon Cassill
33.5
54.5
44.4
45.9
33.50
44.58
35.26
Bubba Wallace
40.4
40.40
40.40
38.14
Daniel Hemric
38.08
Michael McDowell
32.9
23.8
30
28.35
28.90
31.44
Joey Gase
15.10
Cody Ware
30.48
Reed Sorenson
21.3
24.2
48.2
22.75
31.23
30.70
Rankings For The Auto Club 400 (1= Best, 40= Worst)
Race History, Track History, and Track Type History rankings are based on average finishes over the number of races in the above tables.