
Key
Offensive Rankings
PACE – The speed or tempo in which a team plays (1-fastest, 32-slowest)
PPG – Points scored per game (1-most, 32-least)
T.O.P. – Time of Possession (1-most, 32 least)
Total Yards – Total Yards Gained by Offense (1-most, 32 least)
RZ% - Red Zone TD Scoring Percentage (1-best, 32-worst)
OFF PLAYS – Total Number of Offensive Plays (1-most, 32-least)
RUN ATTS – Total Number of Rushing Attempts (1-most, 32-least)
RUN % - Percentage of Offensive Plays That Are Runs (1-highest, 32-lowest)
RUN YDS – Rushing Yards (1-most, 32-least)
RUN YPA – Rushing Yards Per Attempt (1-most, 32-least)
PASS ATTS – Total Number of Pass Attempts (1-most, 32-least)
PASS % - Percentage of Offensive Plays That Are Pass (1-highest, 32-lowest)
PASS YDS – Passing Yards (1-most, 32-least)
PASS YPA – Passing Yards Per Attempt (1-most, 32-least)
Defensive Rankings
DVOA – Football Outsiders Defensive Value Over Average (1-best, 32-worst)
YPGA – Yards Per Game Against (1-least, 32-most)
YPPA – Yards Per Play Against (1-least, 32-most)
RUN YPG – Rushing Yards Per Game Against (1-least, 32-most)
RUN YPA – Rushing Yards Per Attempt Against (1-least, 32-most)
PASS YPG – Passing Yards Per Game Against (1-least, 32-most)
PASS YPA – Passing Yards Per Attempt Against (1-least, 32-most)
DEF VS QB – Fantasy Points Allowed Vs QB (1-most allowed, 32-least allowed)
DEF VS RB - Fantasy Points Allowed Vs RB (1-most allowed, 32-least allowed)
DEF VS WR - Fantasy Points Allowed Vs WR (1-most allowed, 32-least allowed)
DEF VS TE - Fantasy Points Allowed Vs TE (1-most allowed, 32-least allowed)
Matchup Breakdowns
| Colts | AT | Texans | Seahawks | AT | Cowboys | |
|---|---|---|---|---|---|---|
| 1 | PACE | 9 | 26 | PACE | 24 | |
| 5 | PPG | 11 | 6 | PPG | 22 | |
| 18 | T.O.P. | 15 | 6 | T.O.P. | 8 | |
| 7 | TOTAL YDS | 15 | 18 | TOTAL YDS | 22 | |
| 5 | RED ZONE % | 27 | 8 | RED ZONE % | 29 | |
| 3 | OFF PLAYS | 7 | 15 | OFF PLAYS | 10 | |
| 17 | RUN ATTS | 4 | 2 | RUN ATTS | 10 | |
| 26 | RUN % | 7 | 1 | RUN % | 10 | |
| 20 | RUSH YDS | 8 | 1 | RUSH YDS | 10 | |
| 21 | RUSH YPA | 17 | 5 | RUSH YPA | 12 | |
| 2 | PASS ATTS | 27 | 32 | PASS ATTS | 21 | |
| 7 | PASS % | 26 | 32 | PASS % | 23 | |
| 6 | PASS YDS | 17 | 27 | PASS YDS | 23 | |
| 15 | PASS YPA | 6 | 11 | PASS YPA | 19 | |
| 10 | DVOA | 7 | 14 | DVOA | 9 | |
| 11 | YPGA | 12 | 16 | YPGA | 7 | |
| 13 | YPPA | 8 | 24 | YPPA | 8 | |
| 8 | RUSH YPG | 3 | 13 | RUSH YPG | 5 | |
| 6 | RUSH YPA | 1 | 27 | RUSH YPA | 4 | |
| 16 | PASS YPG | 28 | 17 | PASS YPG | 13 | |
| 16 | PASS YPA | 16 | 16 | PASS YPA | 12 | |
| 21 | DEF VS QB | 19 | 21 | DEF VS QB | 23 | |
| 14 | DEF VS RB | 26 | 11 | DEF VS RB | 23 | |
| 30 | DEF VS WR | 24 | 22 | DEF VS WR | 27 | |
| 3 | DEF VS TE | 2 | 24 | DEF VS TE | 8 | |
| Chargers | AT | Ravens | Eagles | AT | Bears | |
| 32 | PACE | 4 | 27 | PACE | 30 | |
| 6 | PPG | 13 | 18 | PPG | 9 | |
| 10 | T.O.P. | 1 | 2 | T.O.P. | 3 | |
| 11 | TOTAL YDS | 9 | 14 | TOTAL YDS | 21 | |
| 10 | RED ZONE % | 20 | 17 | RED ZONE % | 6 | |
| 28 | OFF PLAYS | 1 | 8 | OFF PLAYS | 14 | |
| 19 | RUN ATTS | 1 | 19 | RUN ATTS | 6 | |
| 13 | RUN % | 3 | 24 | RUN % | 6 | |
| 15 | RUSH YDS | 2 | 28 | RUSH YDS | 11 | |
| 7 | RUSH YPA | 12 | 30 | RUSH YPA | 26 | |
| 24 | PASS ATTS | 16 | 7 | PASS ATTS | 24 | |
| 19 | PASS % | 30 | 9 | PASS % | 27 | |
| 10 | PASS YDS | 22 | 7 | PASS YDS | 21 | |
| 3 | PASS YPA | 23 | 12 | PASS YPA | 13 | |
| 8 | DVOA | 3 | 15 | DVOA | 1 | |
| 9 | YPGA | 1 | 23 | YPGA | 3 | |
| 8 | YPPA | 1 | 23 | YPPA | 1 | |
| 9 | RUSH YPG | 4 | 7 | RUSH YPG | 1 | |
| 11 | RUSH YPA | 3 | 20 | RUSH YPA | 4 | |
| 9 | PASS YPG | 5 | 30 | PASS YPG | 7 | |
| 11 | PASS YPA | 2 | 12 | PASS YPA | 1 | |
| 25 | DEF VS QB | 29 | 11 | DEF VS QB | 31 | |
| 9 | DEF VS RB | 31 | 14 | DEF VS RB | 32 | |
| 28 | DEF VS WR | 26 | 3 | DEF VS WR | 13 | |
| 19 | DEF VS TE | 12 | 27 | DEF VS TE | 23 |
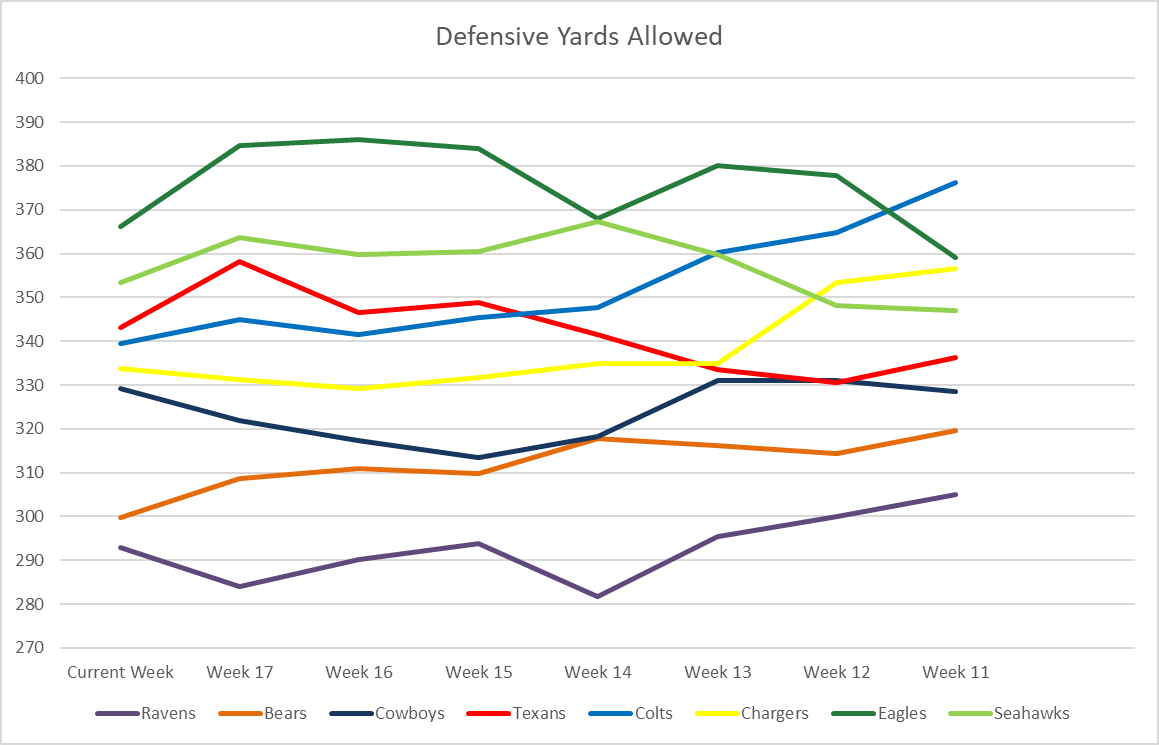
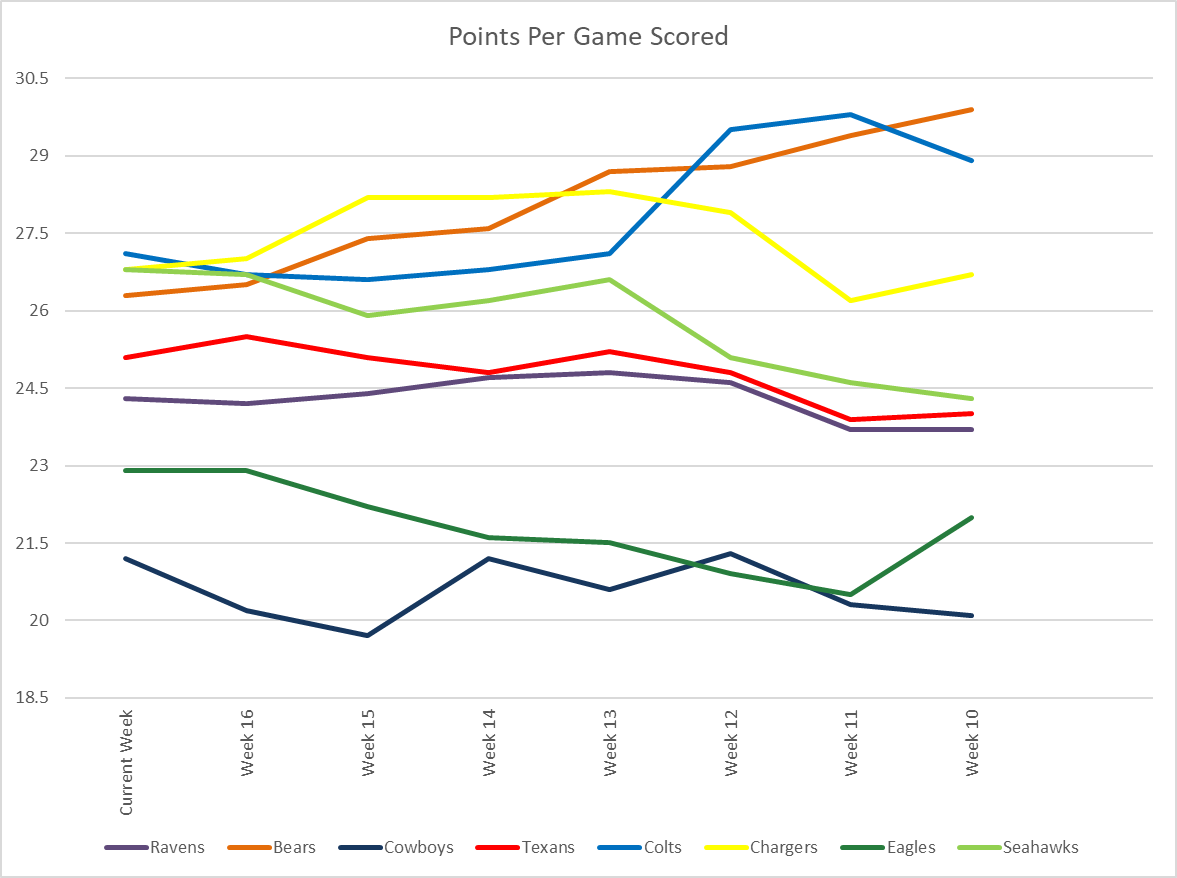
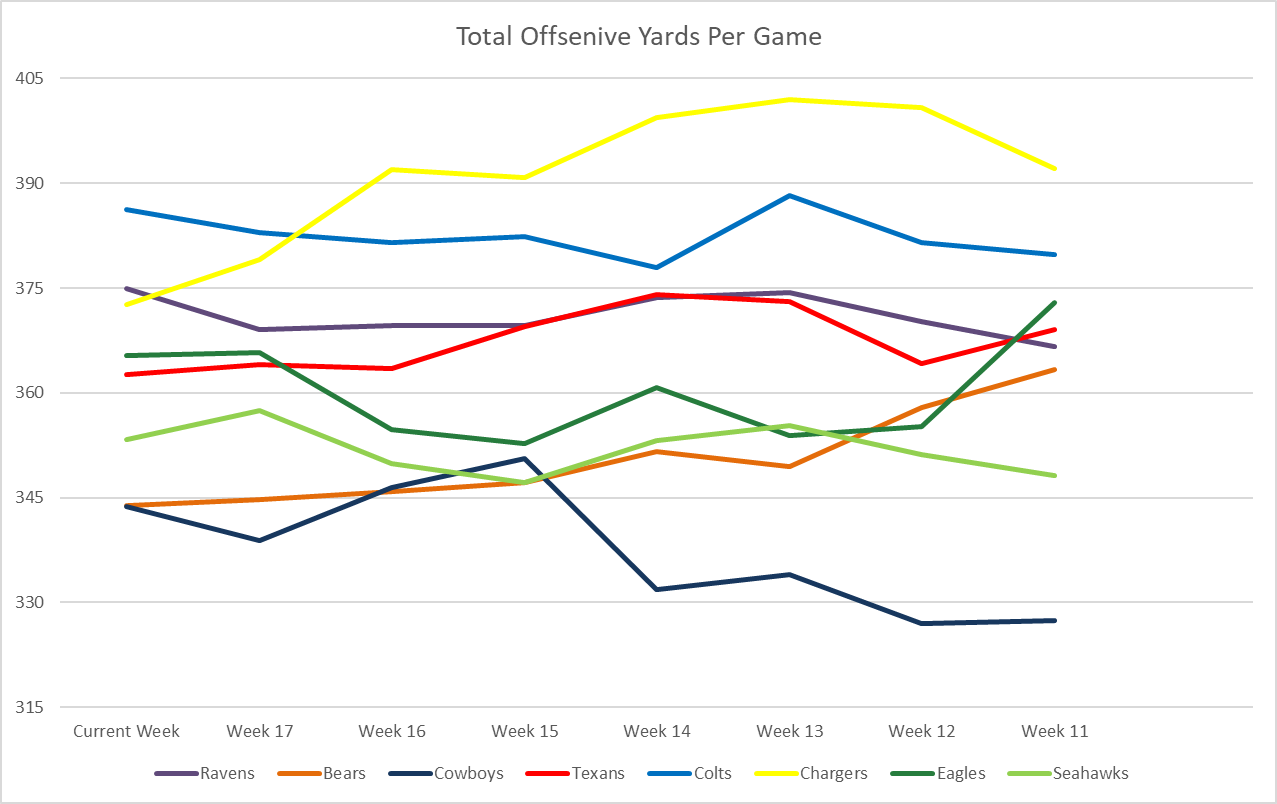
The following charts show the team's trends since Week 11 of the regular season in four key stats.
*DVOA is a defensive metric in which the closer to the bottom of the graph indicates a stronger defense