

Does the ballpark really matter? This is a question many consider when preparing for their fantasy baseball drafts. Each year players switch teams during the offseason and head to stadiums which may be more or less favorable to their fantasy appeal. While there are certainly some ballparks that offer clear advantages for the pitchers and hitters, it’s worth noting that not all hitters in a pitcher’s park suffer.
Nelson Cruz hit .307 with 17 home runs at Safeco Field in 2015 despite its ranking among the worst hitters’ parks in baseball. Jorge De La Rosa is 23-5 with a 3.59 ERA over the last three seasons while pitching at Coors Field, which is one of the league’s most favorable hitters’ parks. But he is just 16-19 with a 4.21 ERA on the road. While these are just two examples of the exception, let’s take a look at the top hitter’s and pitcher’s parks of the last year and how they can affect your fantasy decision making.
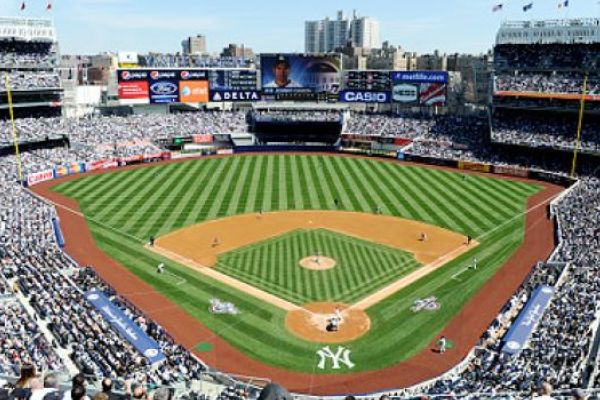
When thinking of a ballpark that favors the hitter some obvious choices come to mind, such as Coors Field in Colorado or Yankee Stadium in New York as both ballparks consistently rank tops in home runs and runs scored. For Coors Field, the stadium is built a mile above sea level which allows a baseball to travel much further than any other park in the league, which often leads to plenty of home runs and runs scored on a given night. Yankee Stadium batters only need to hit the ball 314 feet to right field for a home run, which is one of the shortest distances in all of baseball from home plate to the outfield wall. This has been a key contributing factor to how the Yankees have built their lineups over the years with power-hitting lefties. Games played at Coors Field lead the league with 932 total runs scored during this last season while finishing fourth in home runs allowed with 202. Yankee Stadium finished second in home runs with 219 and sixth in runs scored with 739 (for all the numbers see the table at the bottom of the article).
While those two ballparks provide some of the best offensive outputs in baseball it’s also worth looking at individual players and how their move from one ballpark to another will affect their production. No greater example of this was put on display in 2015 than when Josh Donaldson was traded from the Oakland A’s to the Toronto Blue Jays. Donaldson had little trouble hitting for power as a member of the A’s in a stadium that was far from a hitter’s paradise in the Oakland Coliseum. But in 2015 he would be moving to the Rogers Centre where hitters in 2014 had the fourth-highest OPS (.746) and had hit the second-most home runs (186) in the league. Hitters that played games in Oakland during 2014 had an OPS of .648 and had hit just 139 home runs. With Donaldson finishing 2014 with a career-best 29 home runs, one could only assume his move from Oakland to Toronto would result in a statistical increase in his production. For those who targeted Donaldson in their drafts last year, they were rewarded with an MVP season as he hit .297 with 122 runs, 41 home runs, 123 RBI and an OPS of .939 which all were career-highs with the exception of his batting average. Donaldson’s production jump is not solely because of his move from Oakland to Toronto. His move from the AL West (which boasts some of the more favorable pitching parks in the league) to the AL East (which had four stadiums finish in the top six in runs scored as well as the top-three stadiums in home runs allowed in 2015) also helped.
One big-name player has already signed this offseason with Jason Heyward leaving the Cardinals to go play for the Cubs. The move for Heyward from the Cardinals to the Cubs should be beneficial based on the ballpark and the offense around him, as in 2015 Busch Stadium saw the fewest runs scored (565) and the fourth-fewest home runs (120) while Wrigley Field finished tied for 11th in home runs with 171 and 22nd in runs with 632.
Just as there are ballparks that favor the hitter, there are also plenty of ballparks that favor the pitcher, such as AT&T Park in San Francisco, Citi Field in New York and Petco Park in San Diego. In fantasy baseball the ability to stream pitchers to find the right matchups is a key part of strategy that can help lead you toward a winning season.
In 2015 Busch Stadium had a Major League-best 3.20 ERA, which correlates with allowing the fourth-fewest home runs and the least amount of runs scored in baseball. AT&T Park allowed the league’s fewest home runs at 109 thanks to its incredibly deep dimensions which includes a 421-foot gap from home plate to right center field. In 2015 one of the more notable signings was that of James Shields to the Padres where many were excited for the prospects of somebody of Shields’ ability heading to one of the National League’s best pitchers’ parks. Shields finished the 2015 season 13-7 with a 3.91 ERA and a 1.33 WHIP over 202.1 innings. Looking deeper into those numbers, however, you will see that Shields did in fact pitch much better in the friendly confines of Petco Park, going 6-3 with a 3.29 ERA while going 7-4 with a 4.50 ERA on the road. Staying along the same lines as Shields is one of my favorite streaming plays of 2015 in Jake Peavy, who finished his season with the Giants going 6-2 with a 3.02 ERA at AT&T Park but 2-4 with a 4.24 ERA on the road.
Pitcher parks to avoid are some of the obvious candidates such as Coors Field where pitchers finished the season with a 5.50 ERA after allowing 873 earned runs and 202 home runs and Rangers Ballpark where pitchers finished the season with a 4.63 ERA after allowing 741 earned runs and 177 home runs.
Some big name pitchers hit the free-agent market this season with David Price signing with the Red Sox, Zack Greinke heading to Arizona and the Giants signing both Johnny Cueto and Jeff Samardzija. Cueto and Samardzija are heading to AT&T Park, which is one of the more favorable pitching venues in baseball and is worth taking into consideration when planning for your fantasy draft. Greinke stays in the NL West, which boasts some of the best pitchers’ parks, but does go from Dodgers Stadium which ranked among the lowest in baseball in batting average, OPS and runs scored to Chase Field which dished out the fourth-highest batting average, fifth-highest OPS and seventh-most runs scored.
Price sees the least amount of change in terms of ballpark factor as he stays in the AL East which is one of the more hitter friendly divisions. Price goes from the Rogers Centre in Toronto to Fenway Park in Boston. In 2015 Fenway Park finished second in total runs scored, batting average and OPS but ranked 13th in total home runs thanks to its deep dimensions in center and right field as well as the Green Monster in left that stands 37 feet tall. The Rogers Centre finished third in home runs, fifth in total runs scored and sixth in OPS but just 15th in batting average.
So why does the ballpark matter? I think the proof is in the pudding as you compare the ballpark factors that affect the overall production of both hitters and pitchers. The popularity of daily fantasy sports has made the ballpark one of the more important factors when putting together a lineup as fantasy players begin to become even more advanced as they get involved in the secondary statistics outside of what is shown on the back of a baseball card. Drafting solely based off ballpark factors may not be the most successful strategies, as many of the elite players are able to perform no matter the venue. But the knowledge of the fantasy player increases as does the importance of factors such as where the baseball games are going to be played.
MLB Park Factors - 2015 | |||||||
RK | PARK NAME | RUNS | HR | H | 2B | 3B | BB |
1 | Coors Field (Denver, Colorado) | 1.44 | 1.21 | 1.30 | 1.24 | 2.00 | 1.06 |
2 | Progressive Field (Cleveland, Ohio) | 1.26 | 0.99 | 1.17 | 1.44 | 0.77 | 1.12 |
3 | Oriole Park at Camden Yards (Baltimore, Maryland) | 1.23 | 1.42 | 1.12 | 0.98 | 0.78 | 0.94 |
4 | Fenway Park (Boston, Massachusetts) | 1.19 | 0.97 | 1.10 | 1.28 | 1.03 | 0.92 |
5 | Globe Life Park in Arlington (Arlington, Texas) | 1.14 | 1.07 | 1.11 | 1.10 | 0.95 | 1.13 |
6 | Great American Ball Park (Cincinnati, Ohio) | 1.12 | 1.14 | 1.08 | 1.04 | 0.44 | 1.10 |
7 | Miller Park (Milwaukee, Wisconsin) | 1.10 | 1.43 | 1.01 | 1.07 | 1.16 | 1.01 |
8 | Chase Field (Phoenix, Arizona) | 1.06 | 0.86 | 1.05 | 1.21 | 1.79 | 1.03 |
9 | Citizens Bank Park (Philadelphia, Pennsylvania) | 1.04 | 1.14 | 0.98 | 0.95 | 0.67 | 1.05 |
10 | Yankee Stadium (New York, New York) | 1.02 | 1.25 | 0.98 | 0.89 | 0.63 | 1.00 |
11 | Kauffman Stadium (Kansas City, Missouri) | 1.02 | 0.79 | 1.00 | 1.22 | 1.46 | 0.89 |
12 | Nationals Park (Washington, D.C.) | 1.00 | 1.03 | 0.99 | 1.05 | 0.50 | 1.04 |
13 | Target Field (Minneapolis, Minnesota) | 0.99 | 1.06 | 1.04 | 0.98 | 0.82 | 0.95 |
14 | Wrigley Field (Chicago, Illinois) | 0.95 | 1.28 | 0.93 | 0.79 | 1.09 | 1.03 |
Marlins Park (Miami, Florida) | 0.95 | 0.74 | 0.99 | 0.94 | 1.23 | 1.08 | |
16 | O.co Coliseum (Oakland, California) | 0.94 | 0.78 | 0.96 | 0.97 | 1.19 | 0.91 |
17 | Tropicana Field (St. Petersburg, Florida) | 0.94 | 0.96 | 0.94 | 0.83 | 0.70 | 0.90 |
18 | Turner Field (Atlanta, Georgia) | 0.94 | 0.72 | 0.92 | 0.97 | 0.76 | 1.11 |
19 | PNC Park (Pittsburgh, Pennsylvania) | 0.93 | 1.08 | 0.96 | 0.87 | 0.82 | 1.00 |
20 | Petco Park (San Diego, California) | 0.93 | 1.09 | 0.97 | 0.96 | 0.79 | 0.99 |
Busch Stadium (St. Louis, Missouri) | 0.93 | 0.86 | 1.06 | 1.01 | 1.03 | 0.92 | |
22 | Minute Maid Park (Houston, Texas) | 0.93 | 1.10 | 0.95 | 0.96 | 1.52 | 0.95 |
23 | Dodger Stadium (Los Angeles, California) | 0.92 | 1.00 | 0.95 | 1.06 | 0.64 | 0.79 |
24 | Rogers Centre (Toronto, Ontario) | 0.91 | 1.01 | 0.93 | 1.08 | 0.96 | 1.00 |
25 | U.S. Cellular Field (Chicago, Illinois) | 0.90 | 1.11 | 0.95 | 0.87 | 0.83 | 1.23 |
26 | Comerica Park (Detroit, Michigan) | 0.90 | 0.79 | 0.97 | 0.98 | 1.35 | 0.99 |
27 | Safeco Field (Seattle, Washington) | 0.88 | 0.91 | 0.92 | 0.83 | 0.80 | 0.95 |
28 | Citi Field (New York, New York) | 0.87 | 0.99 | 0.91 | 0.93 | 0.91 | 1.00 |
29 | Angel Stadium of Anaheim (Anaheim, California) | 0.86 | 0.92 | 0.94 | 0.86 | 0.74 | 1.03 |
30 | AT&T Park (San Francisco, California) | 0.85 | 0.60 | 0.92 | 0.84 | 1.65 | 0.99 |
***To read the above: A mark over 1.00 can be read as a positive percentage for the offense. As an example, a mark of 1.18 means the park played at a rate that was 18 percent better than the league average. A mark of 0.96 would mean the stadium was four percent below the league average. |
Park Factor compares the rate of stats at home vs. the rate of stats on the road. A rate higher than 1.000 favors the hitter. Below 1.000 favors the pitcher. Teams with home games in multiple stadiums list aggregate Park Factors.
FORMULA
PF: ((homeRS + homeRA)/(homeG)) / ((roadRS + roadRA)/ (roadG))
homeRS: Runs scored at home
homeRA: Runs allowed at home
homeG: Home games
roadRS: Runs scored on the road
roadRA: Runs allowed on the road
roadG: Road games